 |
|
Seismograms provide scientists with much far more than appears at a first glance. Firstly, since the arrival time of P and S waves depends on the kind of rocks through which they travel, seismologists can know from their study Earth's structure and composition as well as about the faulting causing earthquakes. We can also find other clues in seismograms to locate epicenters and to recognise structural structures. For instance, if we are near the epicenter of an earthquake, we may notice that the P-wave is most clearly visible on the seismogram corresponding to the vertical component, since at the epicenter the main P wave emerges at the Earth's surface at a steep angle. At the same time, a station located east or west from the epicenter, the S wave, being mainly a transverse motion of the rocks, will have its largest amplitude in the north-south direction. Polarization of seismic waves also provides scientists of a lot of information. For instance, they allow to differenciate a natural earthquake caused by a fault break from explosions and also whether the rocks are anisotropic. The rocks crystalls are preferentially aligned in a specific direction. The phenomenon is similar to light deflected by a glass prisma. Closer inspection to seismograms also shows that, appart from the main P, S and surface waves, other impulses are also recorded. They correspond to waves which have traveled through longer paths due to refraction and reflection. Identifying and interpreting them has allowed scientists to find out discontinuities in the global and local ground. Here we will have a look to three uses of seismic waves:
The Test Ban Treaty |
One source of seismic waves, appart from natural earthquakes, are nuclear explosions which take place underground. Since the early 1950's, when public concern was aroused as a result of radioactive fall-out from athmospheric nuclear tests and the scalating arms race, arms control advocates campaign for the adoption of a treaty banning all nuclear explosions. As a result, several test ban treaties were sign during the 60's between the different nuclear weapon states of the world. However, within the context of the cold war, scepticism in the capability to verify compliance with a comprehensive nuclear-test ban treaty posed a major obstacle to any agreement. Concretelly, it was very difficult to check if any country was making explosions underground, since they could be made in such a way that they could not be detected from the surface. Thus, on August 5, 1963, the Limited Test Ban Treaty was signed in Moscow. It was the turning point in the history of the control of nuclear explosions; but, because of the eartquake confusion, it specifically excluded underground tests. |

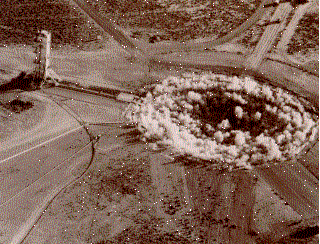
Dust clouds rise at the instant that a subsidence crater is formed after an underground nuclear explosion in mid 1969 at the Nevada Test Side. |
|
At the beginning of the research for a Comprehensive Test Ban Treaty, the necessity arose to employ and refine the basic differences between the different kind of earthquakes (natural and nuclear). To this purpose it was needed:
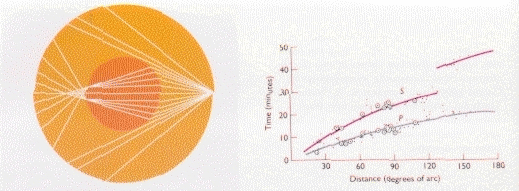
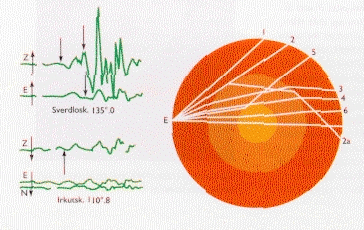
This led to many countries to make major improvements in earthquake recording and research, a global network of standardized seismographs in many countries was established, and research seismologists were given free access to the recordings obtained from it. This new earthquake recording system opened up research opportunities that hitherto had only been dreamed about. Once again, war was the reason for a new science (seismology) to grow up. When a buried nuclear device is detonated, the rock above it is so shattered that often a crater forms and a cylindrical chimney of gas thrust over the surface. Such phenomenons can be observed from high-flying airplanes or satellite cameras. If an underground explosion is to be kept secret, the appearance of a sink could be prevented by boring emplacement holes in alluvial and soft rock deep enough to secure a wide margin of safety. However, even if no surface clues appear, the original explosion and the heaving of rock produce effects that cannot be concealed by even the deepest burial. Irretrievably, elastic waves speed outward through the Earth and annonunce that a nuclear earthquake has occurred. Nuclear earthquakes can be differenciated from natural ones by analysing seismograms at different stations. One critical difference is that an explosion in an underground spherical cavity or underwater is a symmetrical source. In the case of natural earthquakes, at some observational points on the Earth's surface, P waves arrive as an upward push of the surface rocks, corresponding to a compression of the ground; whereas at other observational points, the P waves arrive as a downward pull of the surface rocks, corresponding to a dilation. In sharp contrast, the initial P wave from a symmetrical wave source is recorded on seismographs everywhere as a push of the ground because the explosion drives the rock around it outward in every direction. A second difference is that, because fault ruptures are relatively large, the source of the waves in a natural earthquake covers a larger area, whereas the energy release in an explosion is much more concetrated around a point. Thus, the P and S wave shapes of a natural earthquake are usually different from those produced by underground explosions. Modeling the inner structure of the EarthThe discovery of the Earth's liquid coreOne of the most brilliant pieces of detective work in the history of seismology was the discovery of the core of the Earth by the British geologist R. D. Oldham. Oldham plotted the travel times of both P and S waves from a number of known earthquake sources. To this purpose he procedeed in a similar way as it is done nowadays. Oldham's eartquake sources provided travel times for waves traversing distances from 20 degrees to almost 160 degrees (referenced to the horitzontal plane),as shown in the plot next to this paragraph.  Oldham noted two important discontinuities in the travel-time curves. First, at a distance about 130 degrees, the 'first phase' arrivals, which we now know to be P waves, began to be delayed by a minute or so, on average, compared with the trend suggested by the earliear part of the curve. Second, the curve for the 'second phase', which we now identify as S waves, could only be followed to about 120 degrees; beyond this distance the arrival of the S waves was delayed by 10 minutes or more. To explain the delay, Oldham hypothesized that these S waves had penetrated a central core that transmits S waves at a distinctly slower speed - about half that of waves traveling through the surrounding shell. His argument can be followed easily form the ray diagram in the picture above: the core was not penetrated by waves paths which emerged at 120 degrees, and the great decrease of speed at 150 degrees showed that the wave paths emerging at that distance had penetrated deeply into it (the decrease of wave speed is translated into a change of direction of the rays). Because the rechord at 120 degrees reached a maximum depth from the survace of half the radius, it could be taken that the central core did not extend beyound about 0.4 of the radius from the center. We know now that there are certain dificulties with Oldham's identification of the wave types, and, of curse, the arithmetic is only approximate. A crucial test to Oldham prediction was the detection of earthquake waves reflecting at this discontinuity. As knowledge of the Earth's core grew, more precise models were suggested. In the 1930', it became clear that beyond about 105 degrees, earthquake waves propagating from the other side of the Earth were difficult to observe, direct P waves becoming weak and delayed. In addition, S waves, which do not travel through liquids, could not be identified. All these properties could be explained by assuming the core was located at a depth of about 2900 km and was constitued by liquid rock that had melted as the temperature climbed to more than 5000 C at these depths. The discovery of the Earth's inner coreAnother intriguing story about the use of earthquake waves to sense deep Earth structure tells of a discovery by a Danish seismologist, Inge Lehmann, who in 1936 first published evidence that there is an inner core about the size of the Moon within the outer core. Lehman, when examining seismograms from Pacific earthquakes recorded in Copenhagen, found waves that could not be explained by contemporary models of the Earth's interior. An example of such a wave, flagged by the first indicator arrows, appears in the following seismograms (notice also the ray number 5 in the diagram). Lehmann believed that the arrival times of these waves could be explained if the waves had reflected off a small inner core.  |