GEOL-201, 2004
Geophysical survey, Svalbard area

University of Bergen (UiB)
Dept. of Earth Science (IFG)
Allé gt. 41, N-5007 Bergen, Norway
Tel: (+47) 5558 3600 Fax: (+47) 5558 3660
September 10, 2004 (OM)


The survey was conducted from 4. to 14. september 2004, using RV G.O. SARS. The survey goals were:

  • Sea-floor mapping of Isfjorden areas, continental slope, rift valley and Knipovich ridge, using the Simrad EM 1002 Multibeam sonar
  • Sub-bottom profiling of the same areas, using the Simrad Topas instrument
  • Seismic data acquisition over the margin, slope, rift valley and Knipovich ridge, using both a 3 km, 240 ch streamer and a single-channel streamer
  • Collect gravitymeter data from all areas, using a LaCoste & Romberg marine gravitymeter, updated with ZLS Electronics.
  • Collect Magnetometer data from all areas. The magnetometer, however, has not been fully commisioned for use on the new research vessel yet.
  • Bottom coring samples from selected sites.
  • ROV inspection of selected sites.

This web page is related to data collection from 240 ch. streamer, one-ch. mini-streamer and gravitymeter.


Data, log files

1
Line id.
2
Nav data datum,
UTM Zone / CM
 3
Survey Computer
files:
Shot event files 
4
240 ch, 3 km streamer
5
Mini-streamer data
From LinAcq recording system
6
Gravitymeter
Data files
7
Notes
Log sheet Triacq system logs Scripts, screenshots etc. Log sheet Data
(Seismic Unix format)
Scripts, screenshots etc.
24 WGS84
Zone 33X / 15º
./line-24/EIVA ./line-24/triacq/log-sheet/ ./line-24/triacq/system/ ./line-24/triacq/extras/ ./line-24/linacq/log-sheet/ ./line-24/linacq/ ./line-24/linacq/extras/ ./line-24/gravitymeter/  
25 WGS84
Zone 33X / 15º
./line-25/EIVA/ ./line-25/triacq/log-sheet/ ./line-25/triacq/system/ ./line-25/triacq/extras/ ./line-25/linacq/log-sheet/ ./line-25/linacq/ ./line-25/linacq/extras/ ./line-25/gravitymeter/  
26 WGS84
Zone 33X / 15º
./line-26/EIVA/ ./line-26/triacq/log-sheet/ ./line-26/triacq/system/ ./line-26/triacq/extras/ ./line-26/linacq/log-sheet/ ./line-26/linacq/ ./line-26/linacq/extras/ ./line-26/gravitymeter/  

Table 1: Data, log files


Survey area map overview (click to enlarge)

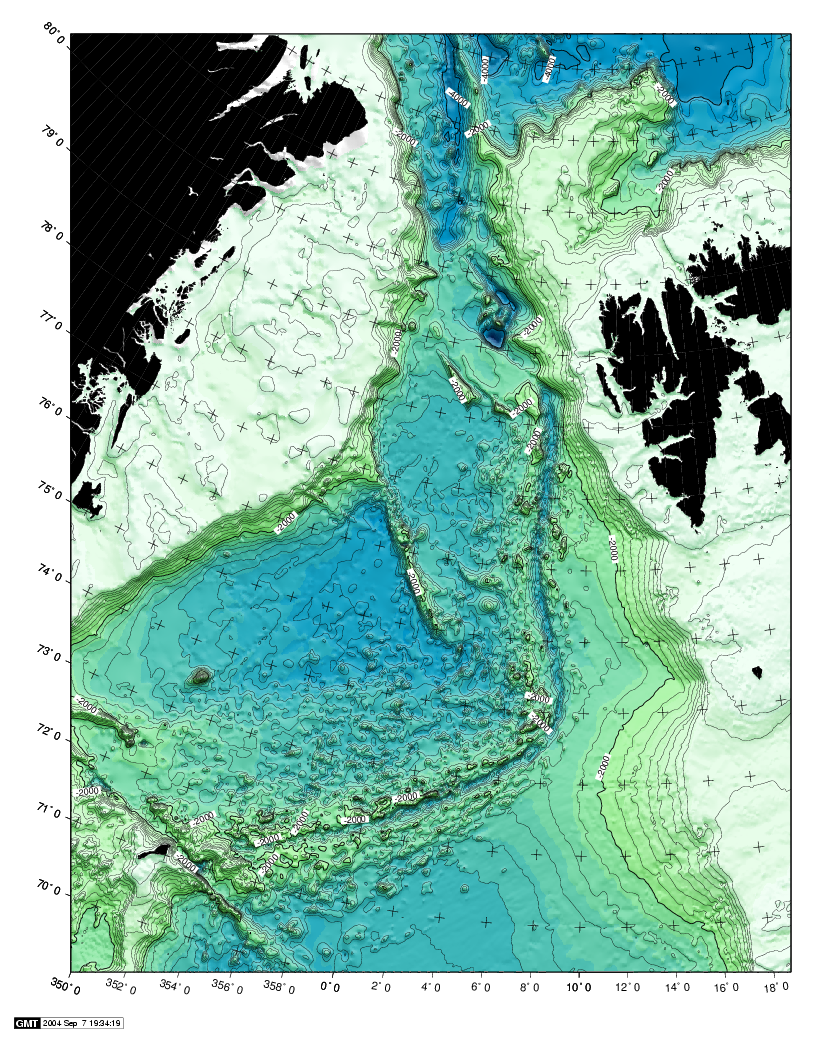
Fig. 1. Jan Mayen Island, Mohn- and Knipovich ridges, rift valley.


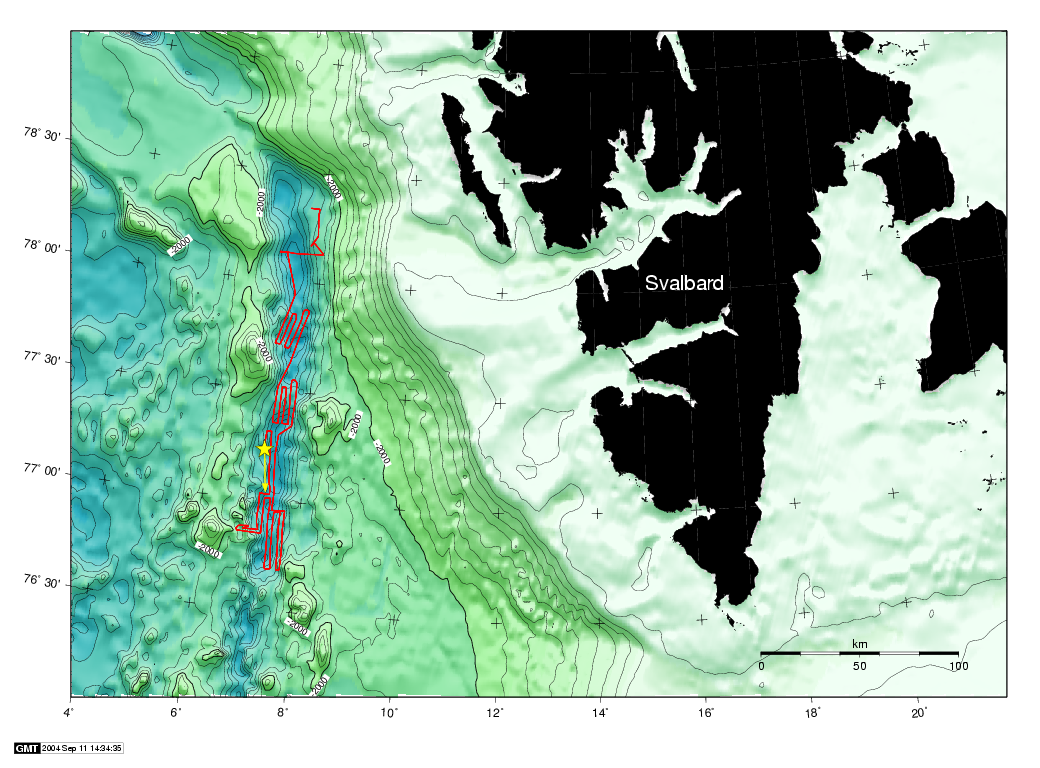
Fig. 2. Ship's trackline shows mapping target area.


Screenshots, seismic data (one-ch. streamer / Topas sub-bottom profiler)