|
|
Jan Mayen Platform 2005RV "G.O. SARS" Geophysical Survey |
University of Bergen (UiB) |

Content |
1. Introduction
Between 15. July and 2. August 2005, Prof. Rolf Birger Pedersen conducted a survey to the Jan Mayen Platform, a relatively shallow area (500-800 m depth) 50 km east of Jan Mayen. The area was mapped by multibeam echo sounder, and detailed investigations carried out by ROV. New hydrothermal vents were discovered, which received world wide attention in news media (see links below). The survey is part of the BioDeep project, supported by the Norwegian Research Council. It includes researchers in Norway, the United States and Sweden. The project seeks answers to questions about microbial life in Earths basement of the ocean floor.
The Instrumentation group delivered a 2 channel mini-streamer c/w recording system, and gravity meter, for background data collection. The mini-streamer system was not used, however.
2. Gravity meter: Base readings and gravity ties
2.1 Base reading / gravity tie Realfagsbygget 14 July 2005
Gravity tie Realfagbygget 14 July 2005 (click to enlarge).
| Date | Day of year | Time [UTC] |
Digital Gravity [CU] |
Spring tension [CU] |
Cross coupling |
Raw beam |
Total correction |
|---|---|---|---|---|---|---|---|
| 14 July 2005 | 195 | 15:49:10 | 13602.4 | 13602.1 | 0.0 | 7.0 | 0.2 |
Table 1. Base reading at Realfagbygget gravity station.
Gravitymeter is placed to the right of the Realfagbygget gravity station, ref. this station description (click to open PDF file):
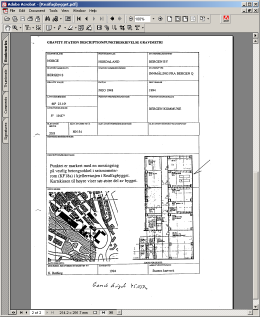
Realfagbygget gravity station description. Click to open PDF file.
The S-99 gravitymeter has the calibration factor 1 counter unit = 0.9967 mGal.
2.2 Base reading / gravity tie Nykirkekaien 15 July 2005
| Date | Day of year |
Time [UTC] |
Digital Gravity [CU] |
Spring tension [CU] |
Cross coupling |
Raw beam |
Total correction |
Height quay over sea surface [m] |
|---|---|---|---|---|---|---|---|---|
| 15 July 2005 | 196 | 12:44:30 | 13606.0 | 13606.2 | 0.0 | -5.0 | -0.3 | 1.60 |
| -"- | -"- | 12:46:30 | 13606.0 | 13606.2 | 0.0 | -6.0 | -0.2 | 1.60 |
Table 2: Base reading Nykirkekaien 15 July 2005.
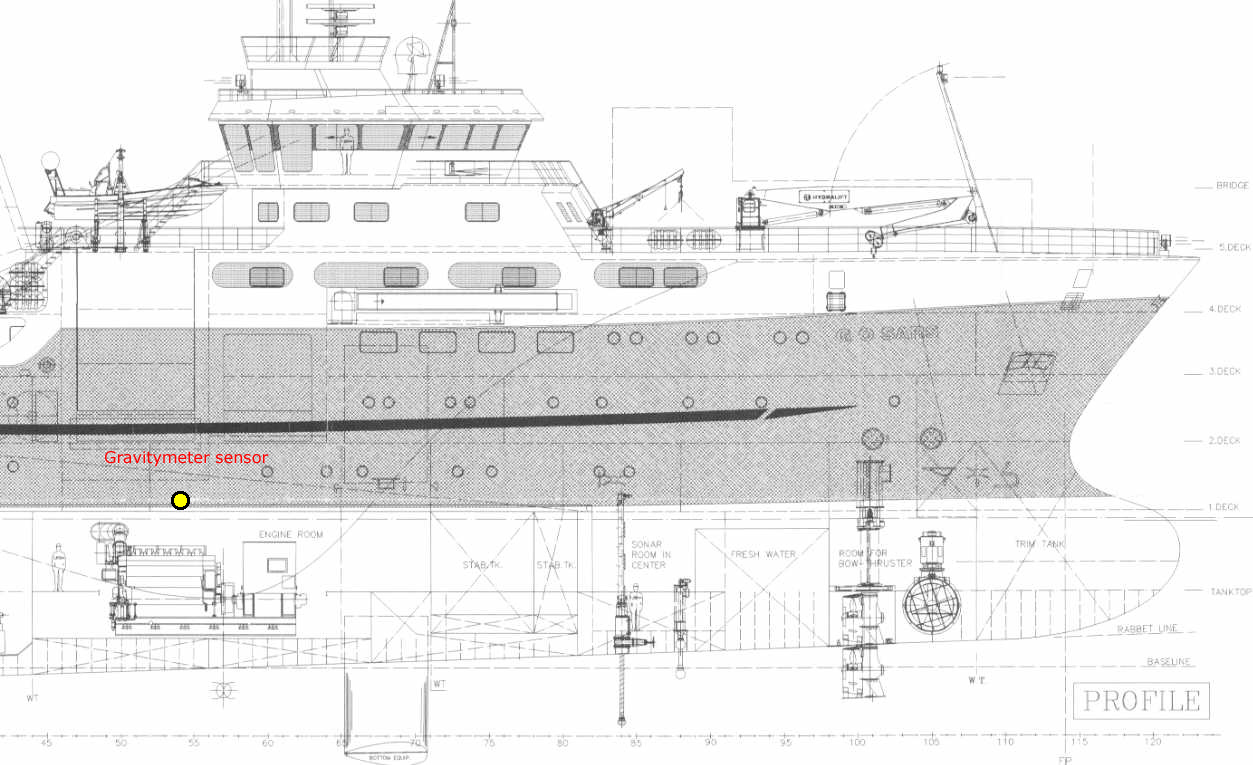
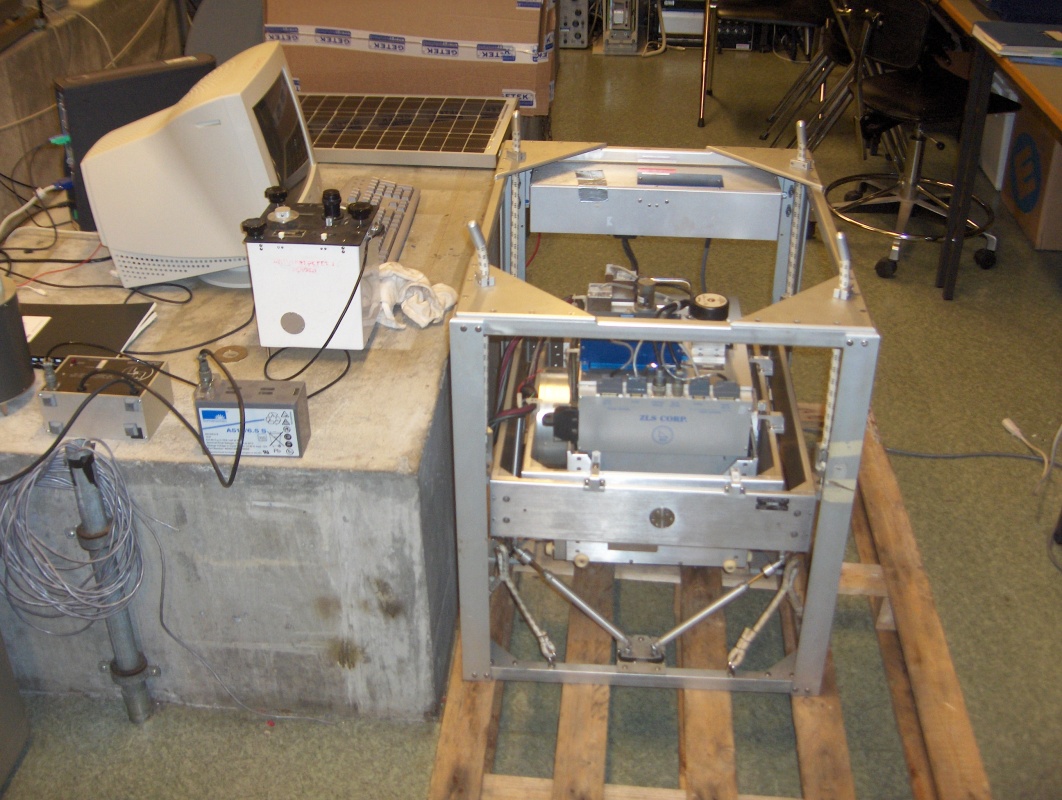
Position of gravitymeter sensor in ship: Deck no 1, in Gyro/Gravitymeter room, frame 54, 40 cm above floor (click to
enlarge). |
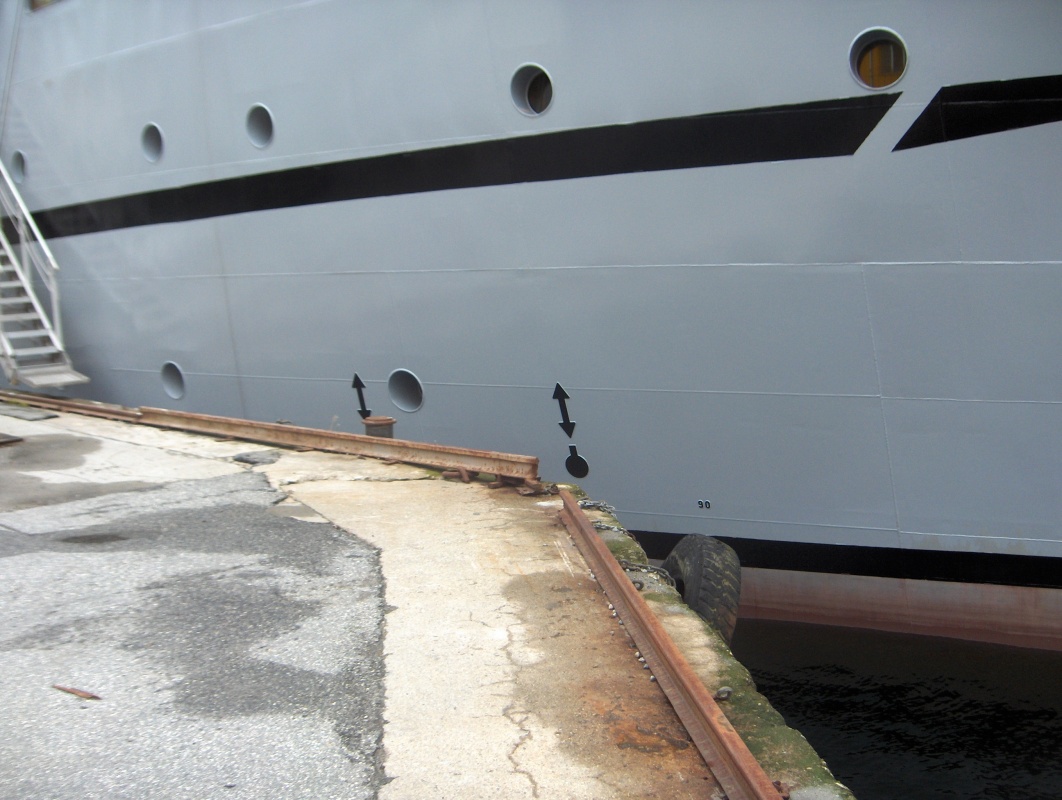
The distance between portholes on 2nd deck (top in picture) and 1st deck is 2.8 m; from this the estimated distance between 1st deck porthole and sea surface is 1.6 m. Gravitymeter sensor estimated to be 1.2 m below center of 1st deck porthole. Conclusion: Gravitymeter sensor is 0.4 m above sea surface (click to enlarge picture). |
The height from quay to sea surface (1.60 m) and distance from sea surface to gravitymeter sensor (0.4 m) means that gravitymeter in ship is 1.2 m lower then land gravitymeter.
Position of land gravitymeter shown below:
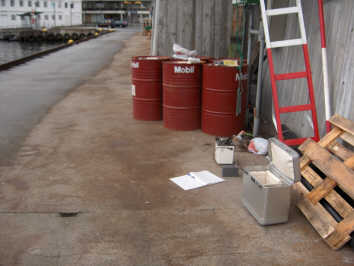
Position land gravitymeter Nykirkekaien, 15 July 2005 |
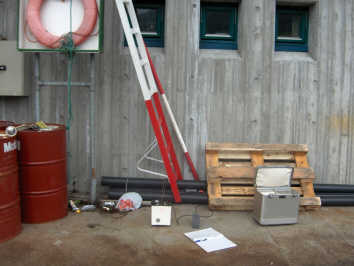
Position land gravitymeter Nykirkekaien, 15 July 2005 |
Note that ship had left Nykirkekaien when these pictures were taken.
Table 3: Gravity tie Nykirkekaien, Bergen, 15 July 2005 |

Calibration table G-936 (click to enlarge) |
|||||||||||||||||||||||||||||||||||
From counter readings in table 3 and calibration table for G-936, the gravity difference in mGal between Realfagbygget and Nykirkekaien can be calculated.
The counter reading value at Nykirkekaien can be rounded-off to 5397.80, and the reading in Realfagbygget to 5393.25, giving a difference of 4.55 units. The calibration factor to use in the counter interval from 5300 to 5400 is 1.02085. Thus a counter difference of 4.55 units corresponds to a gravity difference of 4.55 * 1.02085 = 4.645 mGal.
2.3 Base reading / gravity tie Dampskipskaia Tromsø, 3 August 2005
Base reading Dampskipskaia, Tromsø, 3 August 2005 (data available week 42 / 2005)
| Date | Day of year |
Time [UTC] |
Digital Gravity [CU] |
Spring tension [CU] |
Cross coupling |
Raw beam |
Total correction |
Height quay over sea surface [m] |
|---|---|---|---|---|---|---|---|---|
| 3 August 2005 | 14:30:00 | 2.6 m Note 1 | ||||||
| -"- | -"- |
Table 4: Base reading Dampskipskaia, Tromsø 3 August 2005
Note 1) Estimation of distance from quay to sea surface
Statens Kartverk (Norwegian Mapping Authority) very conveniently operates a tide level gauge at Dampskipskaia. From SVALEX-2004 gravity tie on the same location we know that the distance between quay and sea surface on 14. sep. 2004 at 10:27 local time was 3.0 meter. By comparing this tide level to the tide level on 3. aug. 2005 at 14:30 UTC, we can calculate distance between quay and sea surface on the latter date.
| Tide level Dampskipskaia 14. sep. 2004, 10:20 local time (ref. data file) | 124 cm |
| Tide level Dampskipskaia 3. aug. 2005, 16:30 local time (14:30 UTC) (ref. data file) | 160 cm |
Tide difference on these two dates was 160-124 = 36 cm. Thus distance between quay and sea surface on 3 August 2005 at 14:30 UTC is estimated to be 3.0 m - 0.36 cm = 2.6 m (rounded off).
Gravity tie
The gravity tie to the reference station, also located on Dampskipskaia, can also be estimated (to be continued).
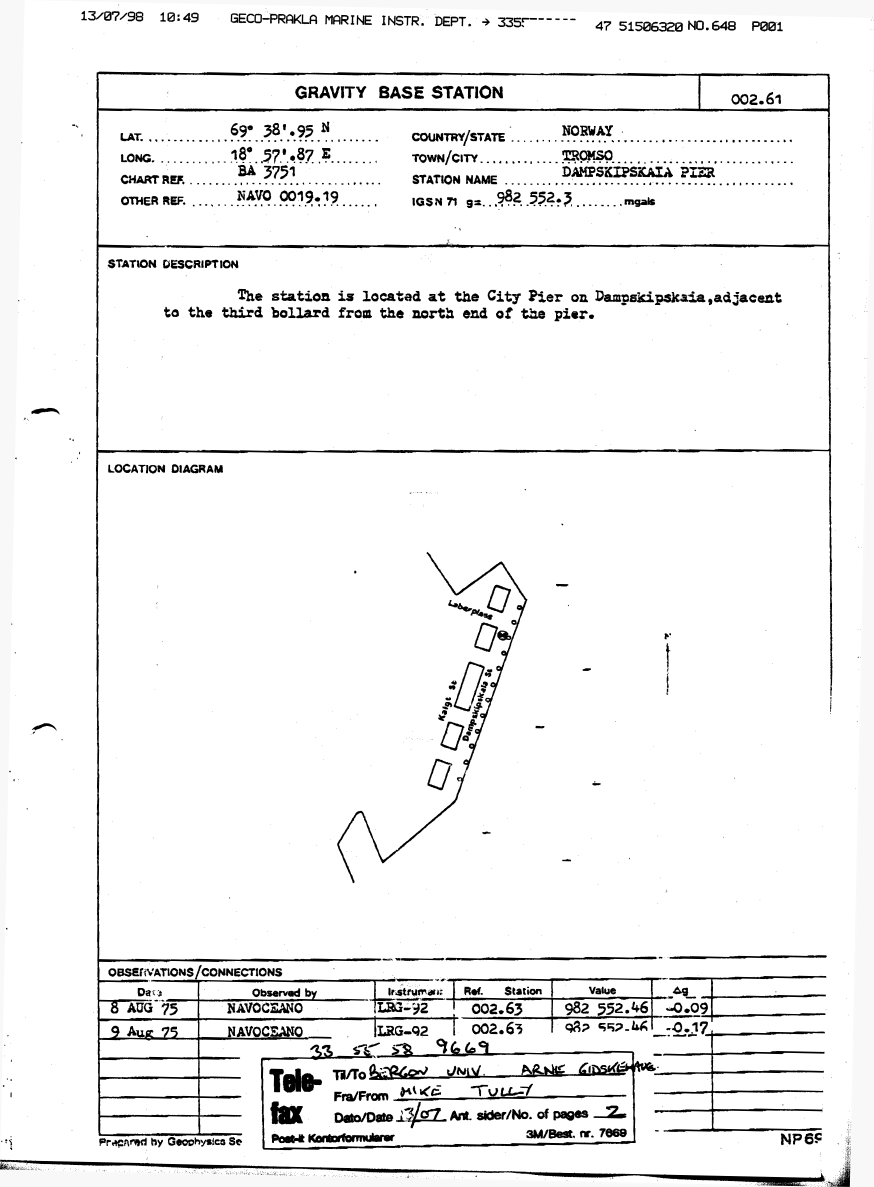
Dampskipskai, Tromsø, gravity station description (click to enlarge)
3. Gravity meter logs, data
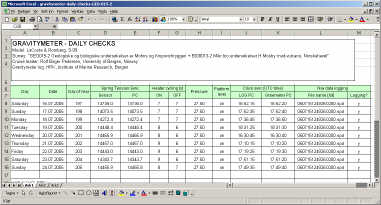
Gravitymeter Daily Checks, click to download.
| Gravitymeter data, with time/position stamp, logged on EIVA survey computer | Link to log file directory |
| Gravitymeter data, raw data stored on gravitymeter PC Data available week 42 / 2005 |
Link to log file directory |
4. Links
-
Researchers Find Hydrothermal Vent Fields In Far North, Science Daily web
-
Northern-most hydrothermal vents revealed, NewScientist.com
-
Installation of earthquake recording station on Jan Mayen.
An "eyewitness" account, by Stig Monsen : http://www.uib.no/people/nglmo/janmayen