|
Marine gravitymeter, S-99
Land gravitymeter, G-936 Data format, conversion Air/Sea operation Base readings Data processing Projects Other information June 07, 2024, at 11:36 AM |
RV "G.O.SARS" 2008: PRE-PROCESSING OF GRAVITY METER DATA
INTRODUCTIONThe gravity meter normally exports data every 10 seconds on the gravity control PC's serial port. These data are collected by a separate computer (the "EIVA" Survey Computer) and merged with latitute/longitude information, which is transmitted every second on the ship's network by GPS units. Unfortunately, on this survey the "EIVA" Survey Computer was not operational, so we have to extract latitude/longitude from ship's navigation record files with one minute sampling interval and, by interpolation, calculate position for each 10-second gravity sample. Depth values must be interpolated in a similar manner. These depth data do, however, exhibit lengthy sections of missing or zero values due to vessel movement or steep gradients in bottom topography, causing problems with the cubic spline interpolation method used. Possible solutions to these problems are outlined below. Ship's navigation record files were infested by various anomalies like duplicates and formatting errors. The manner in which the processing software deals with these anomalies are described in software listings. Processing is performed on a Linux Fedora machine. It should be possible to use Win XP/Vista. Base readings report for this survey is located here.
SUMMARYThe final pre-processing output file, where every 10 second gravity record is furnished with interpolated latitude, longitude and depth values, is here: gravdata-final.txt (approx 10 MByte) Parameters are comma separated. Format description:
A listing of the first lines of this file: 1214807740,30.06.2008,063540,70.457926433,17.148579662,566.7,9916.40 1214807750,30.06.2008,063550,70.458321998,17.147674514,572.4,9916.35 1214807760,30.06.2008,063600,70.458718612,17.146768912,578.2,9916.29 Note that interpolated depth data must be treated with care - ref. description below.
INPUT DATA FILES
SHIP'S NAVIGATION RECORD FILESUncompressing RAR-fileNavigation files were delivered in compressed RAR-format. "UNRAR" the file on Windows platform, using the free 7-Zip program, and transfer unpacked files to Linux/Unix platform for further processing. File typesTwo types of files are available, distinguished by their file name prefix. There is one set of files for each day.
We will use the pos*.csv files in the processing. Nav data processing: Extract/calculate parameters from all input filesWe want to calculate or extract the following parameters from the pos*.csv files. Output values should be comma separated.
Some lines from one of the input files, pos01-07-2008.csv (lines truncated, otherwise web page layout ruined): [olem@uib5 unrar]$ head pos01-07-2008.csv "Ship:","10","","Survey:","2008105","","Date:","01.07.2008" "Station type","Time","Ref. no","Loc.St.no","Logg","Lattitude","Longitude","Depth","Heading","Velocity", ... " -->","00:00:44","",""," 6574.485","7247.6100 N","01124.4244 E"," 1896.07"," 319"," 10.90"," 7.50"," 7.40"," 51.00", ... " -->","00:01:44","",""," 6574.665","7247.7459 N","01124.0265 E"," 1898.93"," 319"," 10.80"," 7.50"," 7.30"," 53.00", ... " -->","00:02:44","",""," 6574.847","7247.8815 N","01123.6293 E"," 1900.64"," 319"," 10.80"," 7.40"," 7.30"," 52.00", ... Extracting and calculating mentioned parameters is accomplished by this Python script: Output file from this script: Listing of the first few lines of the output file: [olem@uib5 navdata]$ head navdata-stage-1.txt 1214807736,30.06.2008,063536,70.457768333,17.148941667,7027.4661,01708.9365,564.42,11.00,324,* 1214807796,30.06.2008,063636,70.460166667,17.143500000,7027.61,01708.61,598.54,11.10,323,* 1214807856,30.06.2008,063736,70.462666667,17.138000000,7027.76,01708.28,631.19,11.10,324,* 1214807916,30.06.2008,063836,70.465166667,17.132500000,7027.91,01707.95,661.80,11.10,323,* 1214807976,30.06.2008,063936,70.467666667,17.127166667,7028.06,01707.63,690.36,11.00,324,*
GRAVITY FILE PRE-PROCESSINGFirst delete all records before 18:00:00 (GPS time) on 29 June 2008, in file 2008_181.dat. Our output file should have these parameter fields.
This Python script will accomplish the task. First lines of output file from this script: [olem@uib5 navdata]$ head gravdata-stage-1.txt 1214762410,29.06.2008,180010,9773.34,9767.36,* 1214762420,29.06.2008,180020,9773.35,9767.36,* 1214762430,29.06.2008,180030,9773.36,9767.36,* 1214762440,29.06.2008,180040,9773.37,9767.37,* 1214762450,29.06.2008,180050,9773.37,9767.40,* 1214762460,29.06.2008,180100,9773.38,9767.45,*
MERGING AND INTERPOLATIONCubic spline interpolation routinePython interpolation routine used is from Numerical Methods in Engineering with Python, by Jaan Kiusalaas, Cambridge University Press (ISBN 0-521-85287-0). Some items must be downloaded. First visit the book's website www.cambridge.org/0521852870. Download the book's Python example code by right-clicking this link. Unzip file and copy these two files to the folder where you do the pre-processing (they will be used like library modules in our own program): - cubicSpline.py
- LUdecomp3.py
In the book, the cubic spline interpolation is treated in section 3.3, example 3.7. Next, we need the numarray numeric library, which must be installed on your computer. Download numarray-1.5.2.tar.gz from http://www.stsci.edu/resources/software_hardware/numarray/numarray.html, select Download or just go to Sourceforge directly. Install from terminal window, as root: % tar -xvzf numarray-1.5.2.tar.gz % cd numarray-1.5.2 % python setup.py config install --gencode This will try to install numarray in Python's site-packages directory. As an aside, numarray is being phased out and replaced by numpy; part of the comprehensive SciPy scientific software package for Python. Generating output fileThis final stage will merge information from navigation pre-processed file with 1 minute sample interval, and gravity pre-processed data with 10 seconds sample interval. Our output file should have these parameter fields.
Here's the software: This script yields the following output file. gravdata-final.txt (approx 10 MByte) A listing of the first lines of this file: [olem@uib5 navdata]$ head gravdata-final.txt 1214807740,30.06.2008,063540,70.457926433,17.148579662,566.7,9916.40 1214807750,30.06.2008,063550,70.458321998,17.147674514,572.4,9916.35 1214807760,30.06.2008,063600,70.458718612,17.146768912,578.2,9916.29 1214807770,30.06.2008,063610,70.459117021,17.145862535,583.9,9916.24 1214807780,30.06.2008,063620,70.459517976,17.144955058,589.5,9916.19 1214807790,30.06.2008,063630,70.459922225,17.144046158,595.2,9916.14 1214807800,30.06.2008,063640,70.460330499,17.143135515,600.8,9916.09 A special output format may be required, here's a Python filter program: convert-to-proper-grav-format.py yielding this output: 30.06.2008 06:35:40 070 27.475586' 017 8.914780' 566.7 9916.40 30.06.2008 06:35:50 070 27.499320' 017 8.860471' 572.4 9916.35 30.06.2008 06:36:00 070 27.523117' 017 8.806135' 578.2 9916.29 Depth interpolation problemThere are lengthy sections of missing or zero depth values in input navigation files due to vessel movement or steep gradients in bottom topography. These gaps in depth input data causes problems in the depth interpolation. It is suggested that this problem is resolved in subsequent gravity meter processing stages. These gaps in the depth data series are common. Please contact author of this report. PLOTS, QUALITY CONTROLCan use AWK to extract subset of data, or do this directly in GNUPLOT. Use AWK to extract relevant columns: The '''-F"," option specifies comma as delimiter. Unix timestamp, latitude and longitude (in decimal degrees) values are in column 1, 4 and 5, respectively.
   awk -F"," '{ print $1, $4 }' ./navdata-stage-1.txt > navdata-time-lat.txt
   awk -F"," '{ print $1, $5 }' ./navdata-stage-1.txt > navdata-time-lon.txt
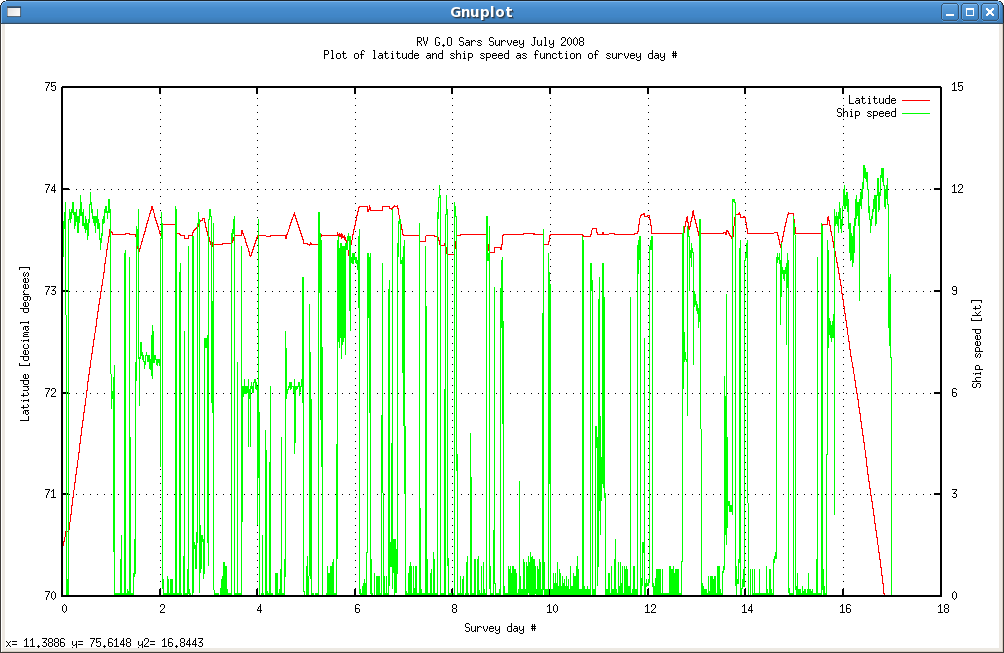
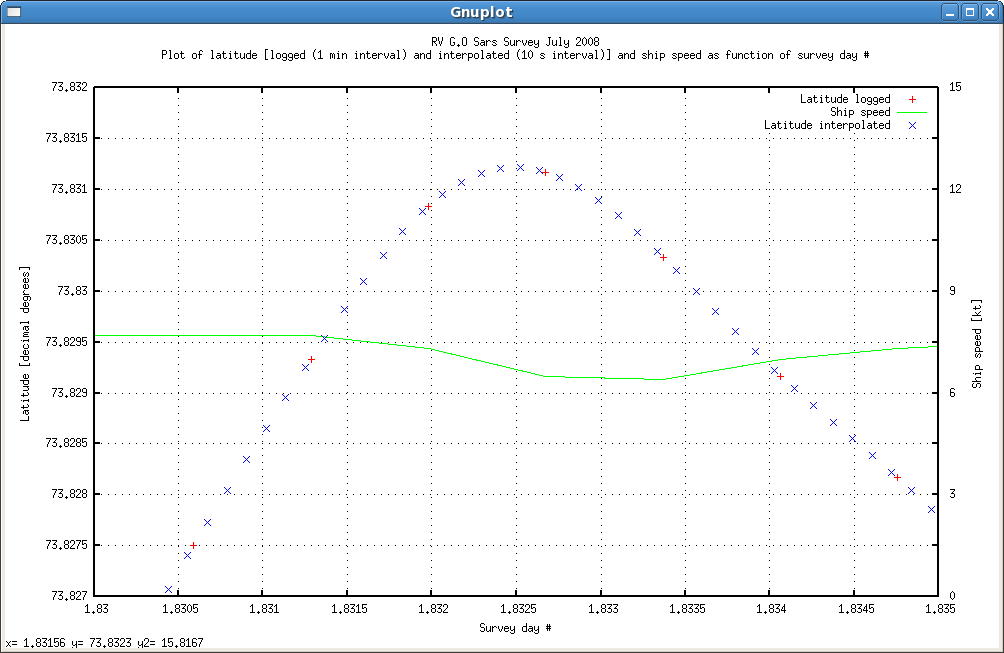
Plot no. 1: Latitude, ship speed vs. time (as survey day number)Proper collection of gravity data depends on keeping fairly constant speed and course along designated survey line. For this particular survey, gravity data collection has lower priority then other type of work and suitable subsets of gravity data must be extracted from main data set, in the periods that ship's speed and course was fairly constant (and the speed was not too high). As an initial assessment of suitable periods, let's plot ship's speed (and latitude) vs. time, expressed as survey day number. Result is shown in fig. 1.  Fig. 1. Plot of latitude, ship speed vs. time (as survey day no.) GNUPLOT commands used in this plot: set grid set datafile separator "," set title "RV G.O Sars Survey July 2008\nPlot of latitude and ship speed as function of survey day #\n" set xlabel "Survey day #" set ylabel "Latitude [decimal degrees]" set yrange [70:75] set xrange [0:] set y2label "Ship speed [kt]" set y2range [0:15] set y2tics border set y2tics 0,3,15 plot 'navdata-stage-1.txt' using (($1-1214807740)/86400):4 with line lt 1 title "Latitude",\ 'navdata-stage-1.txt' using (($1-1214807740)/86400):9 with line lt 2 axes x1y2 title "Ship speed" These GNUPLOT commands are in this file: gnuplot-lat-speed-vs-time.txt Generate plot by typing: gnuplot -persist gnuplot-lat-speed-vs-time.txt Plot no. 2: Latitude (both logged and interpolated), ship speed vs. time (as survey day no.)We also need to confirm operation of cubic spline method used. Let's plot both logged and interpolated latitude vs. time; also throw in ship's speed for good measure. We have selected a time interval in which ship's speed was fairly constant and thus a possible candidate for further gravity data processing.  Fig.2. Latitude (both logged and interpolated), ship speed vs. time
CONCLUSION: The cubic spline interpolation algorithm used works satisfactory. Gnuplot commands for this plot: set grid set datafile separator "," set title "RV G.O Sars Survey July 2008\nPlot of latitude [logged (1 min interval) and interpolated (10 s interval)]\ and ship speed as function of survey day #\n" set xlabel "Survey day #" set ylabel "Latitude [decimal degrees]" set yrange [73.827:73.832] set xrange [1.83:1.835] set y2label "Ship speed [kt]" set y2range [0:15] set y2tics border set y2tics 0,3,15 plot 'navdata-stage-1.txt' using (($1-1214807740)/86400):4 with points lt 1 title "Latitude logged",\ 'navdata-stage-1.txt' using (($1-1214807740)/86400):9 with line lt 2 axes x1y2 title "Ship speed",\ 'gravdata-final.txt' using (($1-1214807740)/86400):4 with points lt 3 title "Latitude interpolated" The expression: using (($1-1214807740)/86400):4 means that we take the value in column no. 1 and subtract an offset, which is the Unix timestamp of the first navigation data record. Then we divide by number of seconds per day, to yield time expressed as survey day number, counting from zero. These GNUPLOT commands are in this file: gnuplot-lat-both-recorded-and-interpolated-plus-speed-vs-time.txt Generate plot by typing: gnuplot -persist gnuplot-lat-both-recorded-and-interpolated-plus-speed-vs-time.txt
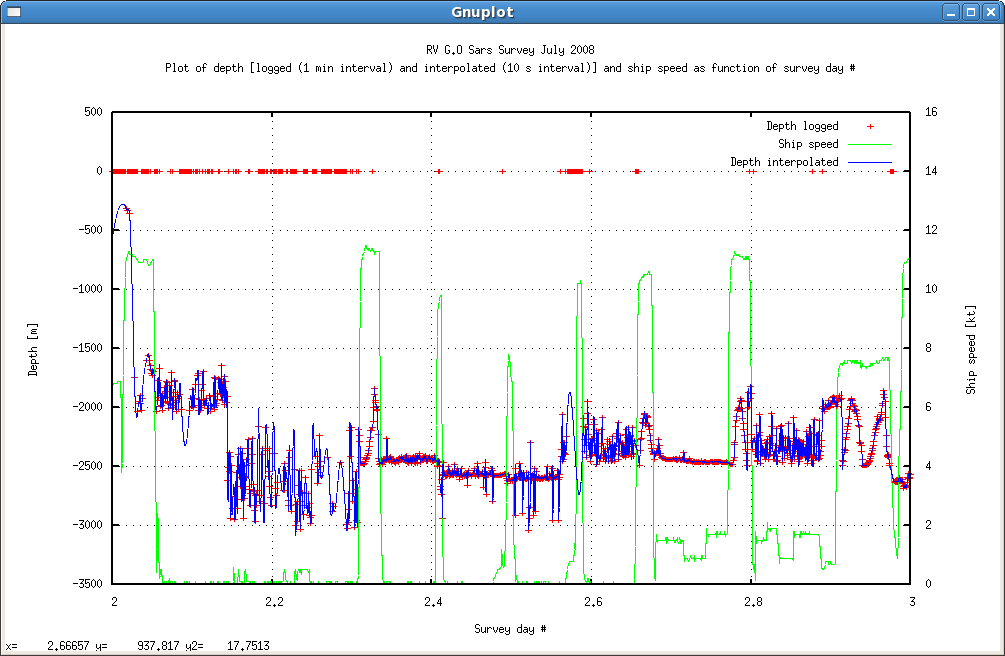
Plot no. 3: Depth (both logged and interpolated) plus ship speed vs. time (as survey day no.)As mentioned, depth interpolation suffers from lengthy sections of gaps in input data. To illustrate, fig 3 plots depth, both logged and interpolated, and ship speed vs. time, for survey day number 2-3. It's easy to spot when depth data is unreliable, and how the interpolation routine desperately tries to cope. It seems that depth data should have all outliers removed and "noisy" sections smoothed out before the interpolation software is put to work. NOTE: Depths logged as zero - or missing altogether - are discarded in interpolation!  Fig. 3: Depth (both logged and interpolated) plus ship speed vs. time (for survey day 2-3). NOTE: Depths logged as zero - or missing altogether - are discarded in interpolation! Note how logged zero depth values - meaning data gaps - are lumped together on sections of the x-axis. Logged depth data field could also be completely empty in such cases; nav data pre-processing software should probably replace empty depth fields with zeros so values would turn up in plots ... Gnuplot commands for this plot: set grid set datafile separator "," #set key top right #set key box set title "RV G.O Sars Survey July 2008\nPlot of depth [logged (1 min interval) and interpolated (10 s interval)]\ and ship speed as function of survey day #\n" set xlabel "Survey day #" set ylabel "Depth [m]" set xrange [2:3] set yrange [-3500:500] set y2label "Ship speed [kt]" set y2range [0:16] set y2tics border set y2tics 0,2,16 plot 'navdata-stage-1.txt' using (($1-1214807740)/86400):(-$8) with points lt 1 title "Depth logged",\ 'navdata-stage-1.txt' using (($1-1214807740)/86400):9 with line lt 2 axes x1y2 title "Ship speed",\ 'gravdata-final.txt' using (($1-1214807740)/86400):(-$6) with line lt 3 title "Depth interpolated" These GNUPLOT commands are in this file: gnuplot-depth-both-recorded-and-interpolated-plus-speed-vs-time.txt Generate plot by typing: gnuplot -persist gnuplot-depth-both-recorded-and-interpolated-plus-speed-vs-time.txt |