|
Surveys and data
Instruments
Support to other department sections
Support Dr. Scient. thesis
Contribution to "Scientific infrastructure"
Obsolete, kept for reference
edit SideBar
Last update: April 30, 2025, at 08:49 AM
Version: pmwiki-2.3.38
|

| Title
OBS-2013: Instrumentation notes
| By
O.M.
| Date
06 February 2014
| Version
0.1
|
 Click to see OBS-2013 photo album. Click to see OBS-2013 photo album.
SURVEY, PROJECT DESCRIPTION
| Survey duration
| 14 - 17 September 2013
| | Project name
| -
| | Project leader
| Prof. Rolf Mjelde, Department of Earth Science,
University of Bergen
| | Project funding
| -
| | Project duration
| -
| | Party chief
| Asbjørn Breivik, Department of Geosciences,
University of Oslo
|
GEOPHYSICAL EQUIPMENT
| Item no.
| Name
| Description / Setup
| | 1
| Mini-streamer
| We are using an 8-channel mini-streamer: MicroEel, by Geometrics
| | 2
| Recording for Mini-streamer
| Geometrics GEODE.
- S/N: 4153 ("CIPR-1")
- Sample interval: 2 ms
- Recording time: 8 s
- Data format: SEG-Y
- Filter settings: Only anti-alias filter (automatically adapted to sample rate).
| | 3
| Gravitymeter
|
- Manufacturer, electronics: ZLS
| | 4
| Magnetometer
|
- Manufacturer:Geometrics
- Model: Mod. G-882
| | 5
| Time stamping equipment
| ProFlex Lite DG14
| | 6
| Navigation system
|
- EIVA Survey Computer
- Diff GPS:
- Fugro "SeaStar", mod. 3510 LR
| | 7
| Airguns
|
- 4 ea, Bolt model 1500, each 1200 inch 3 , in total 4800 inch 3
- Air pressure, firing moment: 138 Bar = 2000 psi
- Source depth: 6 m
| | 8
| Gun control system
| Geco GUNCO
|
DATA
Profiles
| LINE INFORMATION
| EIVA SURVEY COMPUTER
| GPS TIMESTAMPS
| MINI-STREAMER
| UKOOA
| LOG SHEETS
| COMMENTS
| | ID
| SP INT [m]
| START
SP Date Time [UTC]
Easting Northing (UTM Zone 33)
| END
SP Date Time [UTC]
Easting Northing (UTM Zone 33)
| EVENT FILE
| 10 SECONDS LOGFILE
| RAW
| PROCESSED
| LOG FILES
| SEG-Y
| P1/90 FILES
| P1/90 QC FILES
| | LINE 1
| 200
| 0003
15.09.2013
03:48:37
575366.9 7705601.1
| 881
16.09.2013
01:00:49
428585.7 7802715.8
| Link
| Link
| Link
| Link
| Link
| 2436.sgy
| Link (preliminary)
| Link (preliminary)
| -
| -
|
PRELIMINARY ANALYSIS OF MINI-STREAMER IRREGULARITIES
Description of irregularities
- First breaks (= direct arrival of air gun signal, following a straight line from source to receiver) arrives much too early.
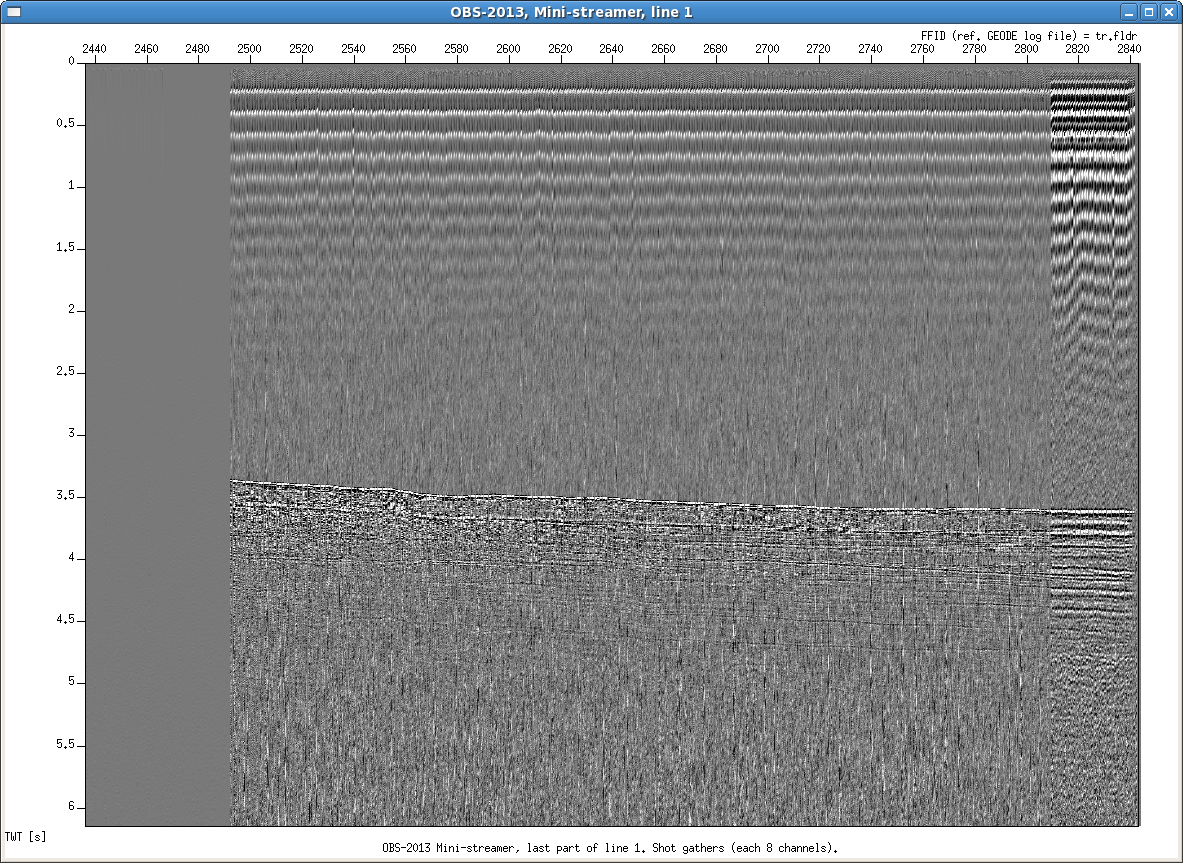
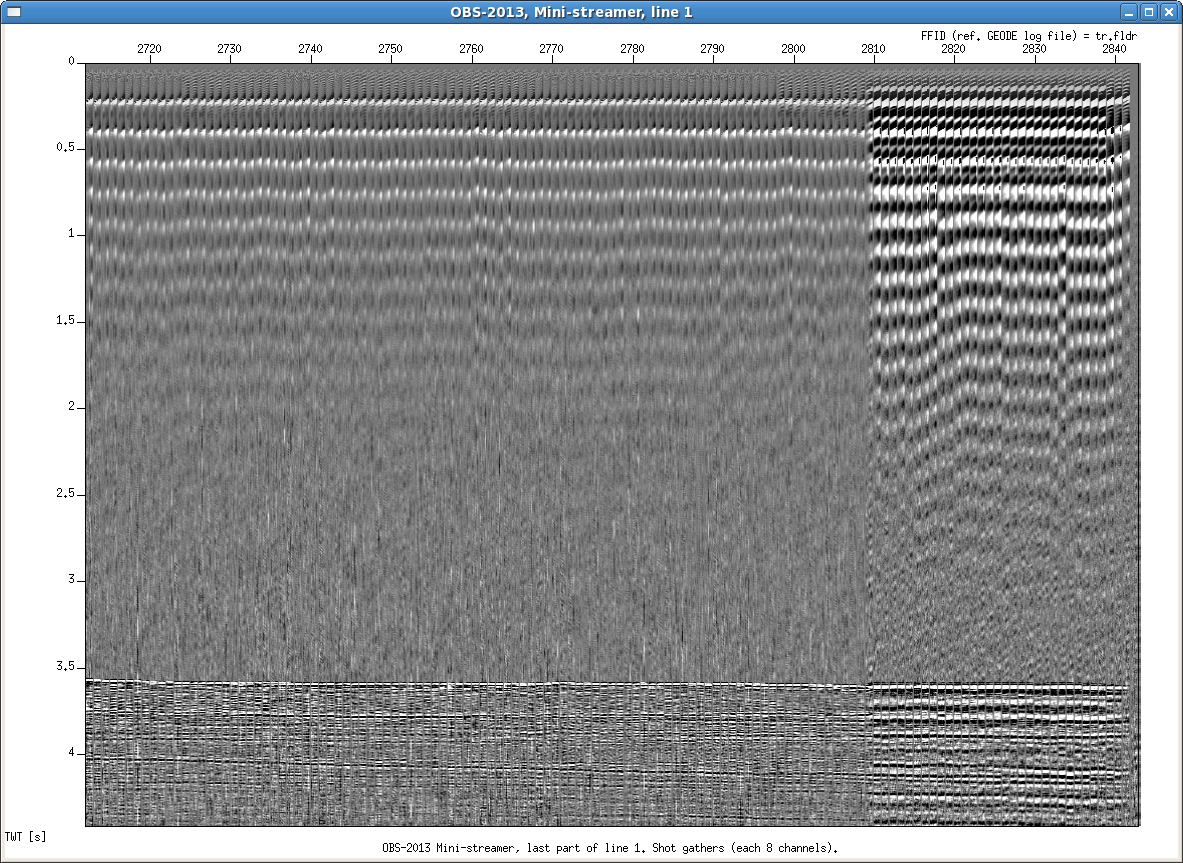
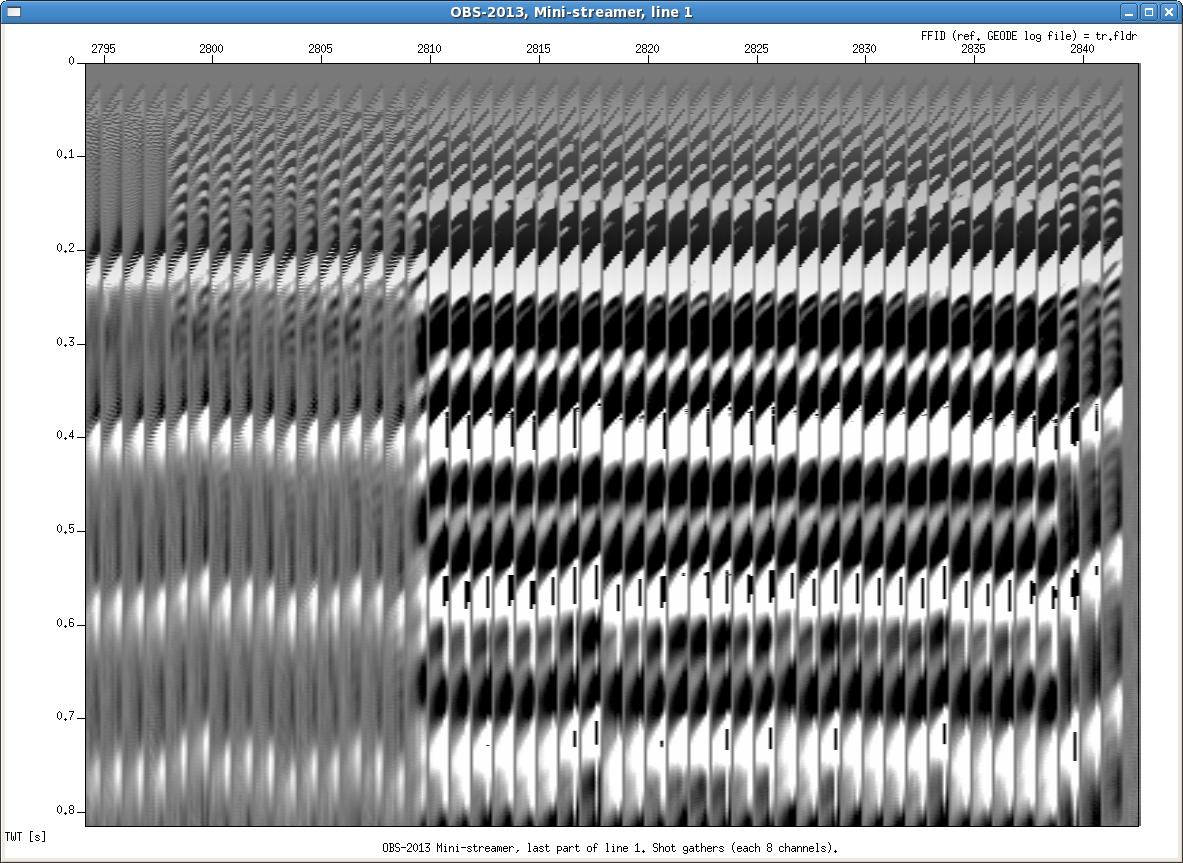
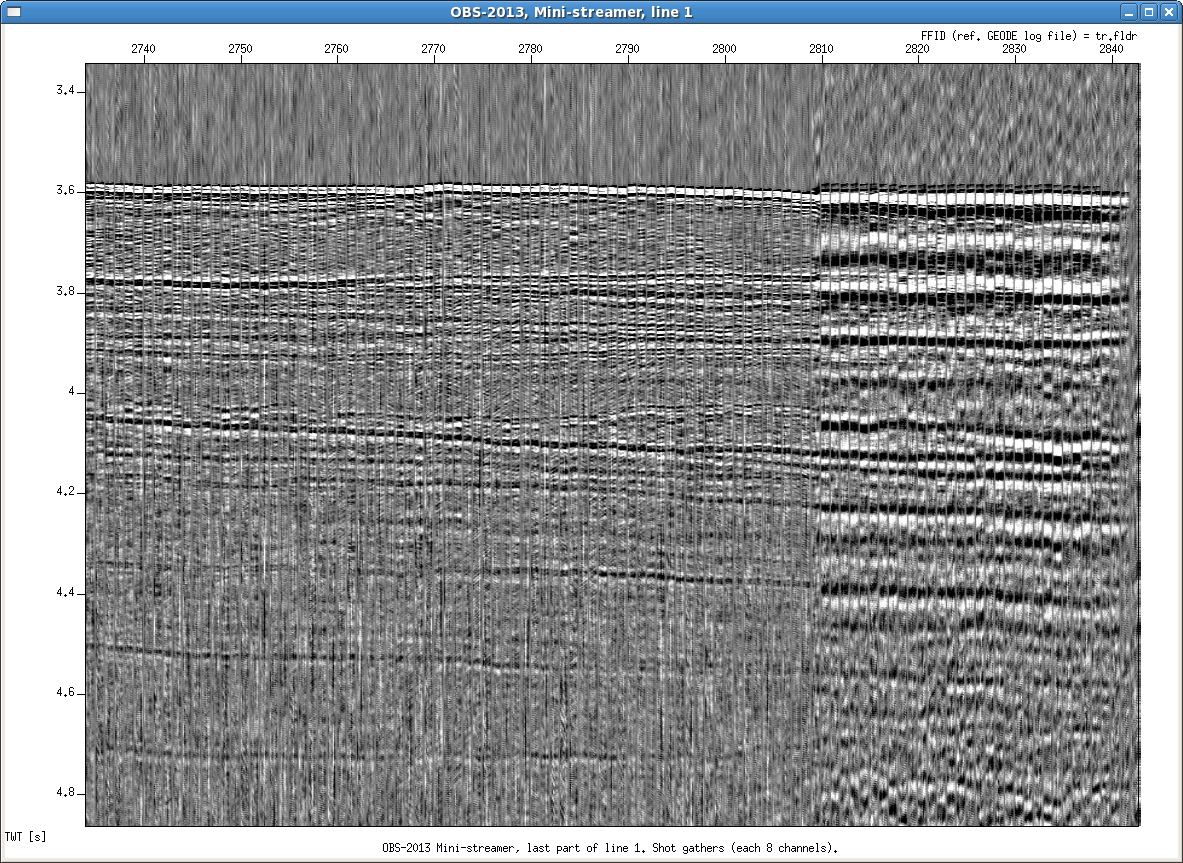
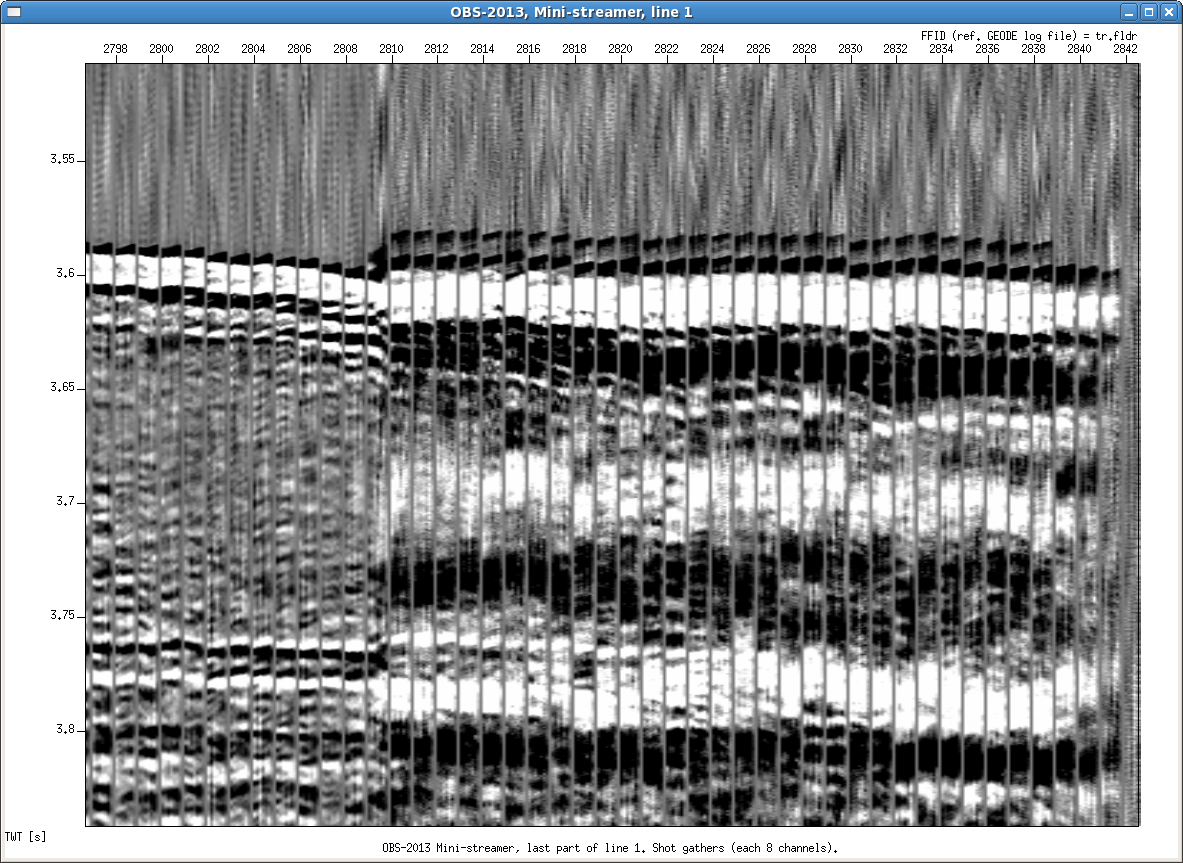
- From FFID = 2809 the frequency content of the signal changes considerably. The recording log does not indicate any changes in system configuration - like number of guns firing, air pressure, de-activation of filtering in the GEODE mini-streamer recording system. The sudden change in signal characteristics is easily observable both in the time and frequency domain (see plots below).
- In shot gather displays, channel 8 - the most remote channel - appears to be nearest to the vessel.
- The frequency plots show an unusual amount of signal energy in the very low-frequency part of the spectrum.
Conclusions
Based on error analysis below, we have arrived at the following conclusions:
- The Mini-streamer tail buoy has probably been snagged into airgun floats, causing the streamer to take the shape of an "U" behind the ship. Channel no 8 was thus located nearest to the ship.
- Before FFID=2809 offset between source and center of nearest group (no. 8, due to the streamer U-shape mentioned above) is approx. 24 meter, and after FFID=2811 it is approx. 9 meter. Offset is of course much too small. It is assumed that hydrophone group no. 8 has been damaged because of this. Normal offset should be approx. 102 meter.
- The frequency spectrum indicates presence of unusual amount of signal energy in the very low frequency part (0-10 Hz). We believe this is due to the streamer U-shape causing lots of oscillations.
- After FFID=2811 it seems the streamer positioned itself much deeper in the water. By looking at bottom reflections before and after FFID=2811 the depth difference seems to be 15.6ms, which is two-way travel time; thus increased depth should be (15.6ms * 750m/s) = 11.7 meter. This will increase the streamer's ability to capture low frequency signals.
Mini-streamer layout, source position, expected First Break times
- Mini-streamer:
- Number of hydrophone groups: 8 ea
- Group center spacing: 6.25 m
- Number of hydrophones per group: 12
- Hydrophone spacing within group: 0.5 m. Thus group length is (11*0.5 m) = 5.5 m
- Lead-in length: 150 m
- Lead-in deployed, from stern: 135 m
- It appears that channel 8 is defective (no reflections).
- Source:
- Distance from stern to source: 36 meter
- Offset between center of source, and midpoint of first group in streamer should thus be: (135m-36m) + (5.5m/2) = 101.75m. Assuming sound velocity of 1500 m/s, first break should arrive after 0.0678s = 67.8 ms
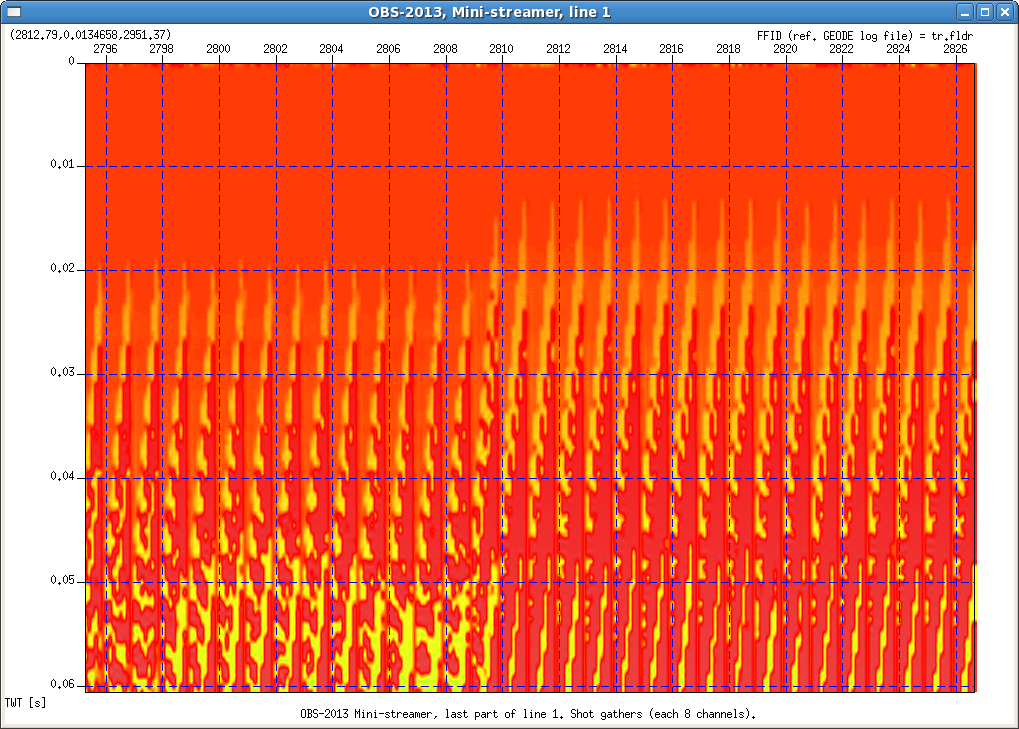 Offset between source and first group: Before FFID 2809, group 7 (as no. 8 is defective) has First Break after 20ms; which means that ch. 8 should have First Break after (20-4.2) = 15.8ms (see below). That means offset is (15.8ms * 1500m/s) = 23.7m. After FFID=2811, offset is (13.5ms-4.2ms)*1500m/s => (9.3ms*1500m/s) = 9.3m. Offset between source and first group: Before FFID 2809, group 7 (as no. 8 is defective) has First Break after 20ms; which means that ch. 8 should have First Break after (20-4.2) = 15.8ms (see below). That means offset is (15.8ms * 1500m/s) = 23.7m. After FFID=2811, offset is (13.5ms-4.2ms)*1500m/s => (9.3ms*1500m/s) = 9.3m.- Mini-streamer group center spacing is 6.25 m. With a water sound velocity of 1500 m/s the first break time difference between each channel should be: (6.25 m / 1500 m/s) = 0.0042 s = 4.2 ms
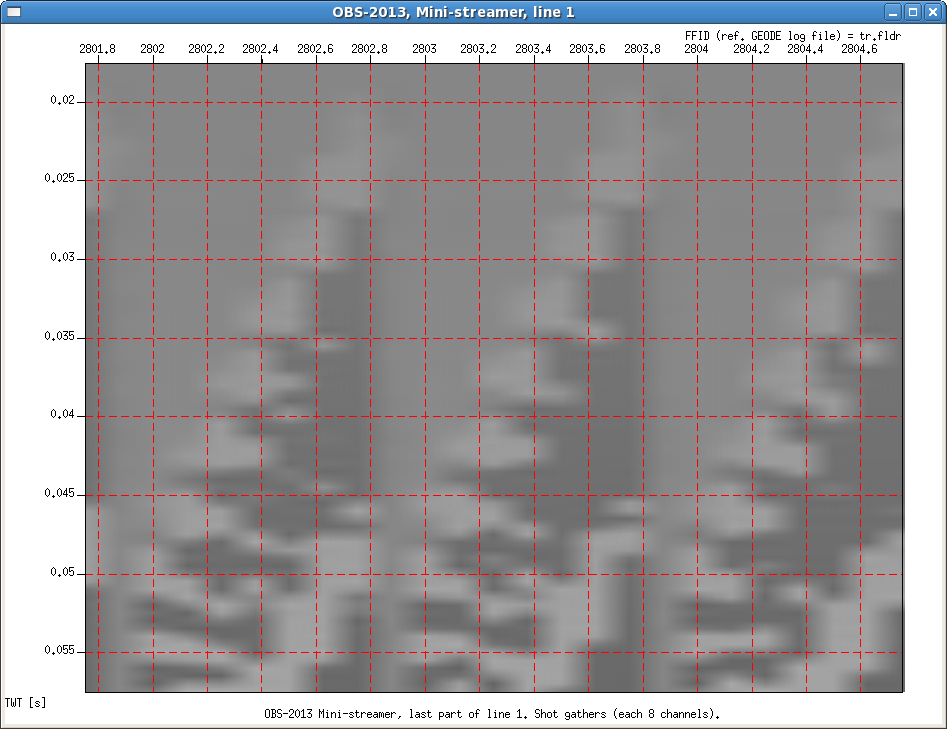 The 8 individual channels in each shot gather shown. Measured First Break time difference between two successive groups: 4.1 ms - expected 4.2 ms - that's a fairly good match. We can thus assume active section is aligned to ship's long axis. The 8 individual channels in each shot gather shown. Measured First Break time difference between two successive groups: 4.1 ms - expected 4.2 ms - that's a fairly good match. We can thus assume active section is aligned to ship's long axis.Dimensions:
  Lead-in ............................: 150.00 m
  Active section: (7*6.25m) + 5.5m  ..:  49.25 m   (8 hydrophone groups 6.25 m apart, one half group (group length 5.5 m) at each end.
  Tail ...............................:  12.50 m
                                        --------
                       Total length ..: 211.75 m
                       -------------------------
Viewing data in time domain
Data in time domain - click to enlarge
| 
|
|---|
| 
| 
| 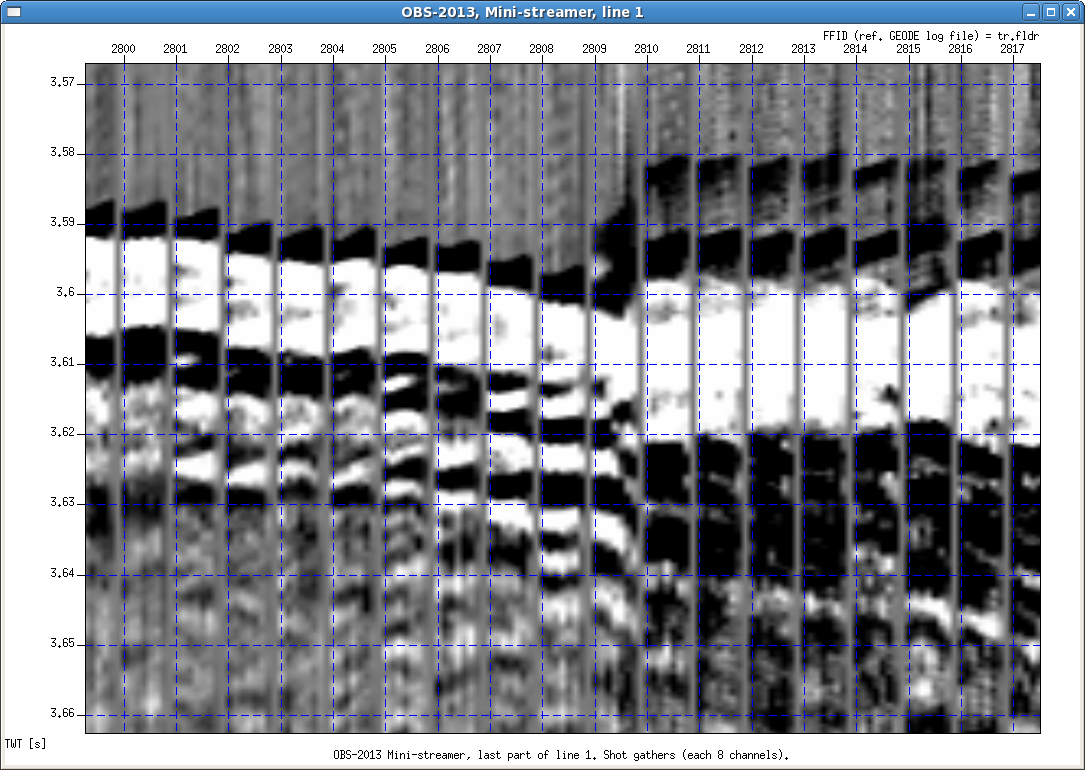
Difference between arrival time of bottom refection before and after FFID=2810 measured to 15.6 ms (TWT), which amounts to 11.7 meter.
|
Frequency domain analysis
Data in frequency domain - click to enlarge
|


