|
Marine gravitymeter, S-99
Land gravitymeter, G-936 Data format, conversion Air/Sea operation Base readings Data processing Projects Other information June 07, 2024, at 11:36 AM |
RV "G.O. SARS 2008: LINE SELECTIONThis is a continuation of previous processing of data from this survey.
INTRODUCTIONWe want to select some lines for further gravity processing. This report details the identification of possible candidates. T. Svendsen plotted candidate lines, and extracted relevant sample data to file. White lines on map below shows these possible lines.  RV "G.O.SARS" 2008 survey lines - white ones candidates for further gravity processing" (map: T.S) INPUT FILEThis file contains list of 10 second gravity values, including time- and position stamping. All candidate lines are included in one file. Excerpt: LINE1 1214942640,01.07.2008,200400,73.380018506,8.887070837,2415.2,10032.91 1214942650,01.07.2008,200410,73.379587858,8.887253941,2415.2,10032.93 1214942660,01.07.2008,200420,73.379156183,8.887189275,2415.2,10032.95 ... 1214965300,02.07.2008,022140,73.808221948,6.792030334,2974.4,10089.14 1214965310,02.07.2008,022150,73.808439438,6.791287059,2973.1,10089.19 1214965320,02.07.2008,022200,73.808676574,6.790616242,2972.2,10089.24 LINE2 1214966220,02.07.2008,023700,73.828875631,6.834000062,2985.2,10072.08 1214966230,02.07.2008,023710,73.828712652,6.834995784,2985.8,10072.12 1214966240,02.07.2008,023720,73.828551297,6.836000340,2986.5,10072.15 1214966250,02.07.2008,023730,73.828387949,6.837011705,2987.1,10072.17 ... Parameter description:
PROCESSINGAs first stage in line selection, we want to plot ship speed for all lines. After that we will decide which line (or part of each) that is suitable for further processing. This is achieved by:
An external library is used for LAT/LONG to UTM conversion. Processing software (first part consists of LAT/LONG conversion library): RESULTSClick image below to see all plots: 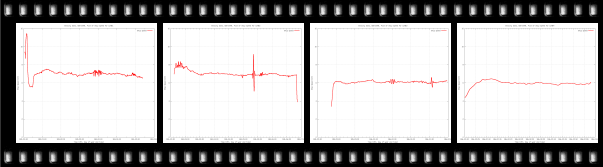 |