
|
Surveys and data Instruments
Support to other department sections Support Dr. Scient. thesis Contribution to "Scientific infrastructure"
Obsolete, kept for reference
Last update: April 30, 2025, at 08:49 AM |
GMT DATA SETS, MINI-TUTORIALMAPPING WITH GMT - AN INTRODUCTIONGeneric Mapping Tools (GMT) is a free software package that can produce maps of various types. At first sight its size and complexity may seem a bit intimidating. This web page provides some introductory examples. Also, the GMT documentation contains lots of map examples and tutorials. BEFORE YOU START: First determine size of PostScript plot. We recommended you start with gmtset PAPER_MEDIA A4, gmtset DOTS_PR_INCH 600, and in the projection specify 20 cm width, as in this example: -JB6/65/69.0/74.0/20c. When you generate PDF by the ps2pdf command, you can zoom down to the finest details without pixel smearing. In many of the examples below, however, the paper and plot size has been set too large. Some examples - click images to enlarge:

 You want to capture GPS data and plot the track line. In this example we used a Garmin GPS35-HVS with serial RS-232 output. The GPS is connected to the Linux laptop serial port. First take a look at the data by typing cat /dev/ttyS0 Assuming you have read access to the serial port; if not write (as root): chmod +r /dev/ttyS0 Default baud rate is normally 9600 bits/s. View current settings (for com1) by writing: stty -F /dev/ttyS0 -a If needed, set correct speed by stty -F /dev/ttyS0 9600 -echo The last option also disables echoing of characters. Add cat /dev/ttyS0 > gps-data.txt & Check what's being stored by typing tail -f gps-data.txt Further processing of GPS NMEA telegrams, in order to extract and convert NMEA Latitude/Longitude data - see below.


 Like top example, just different Region and parallels in -J option.
CONVERT POSTSCRIPT PDF AND PNGAs mentioned in the beginning, start with A4 paper size and use a high resolution, like 600 dpi, so that you can increase size later without seing pixel crudeness. To create PDF, use the GMT command: ps2pdf in.ps out.pdf. To make PNG, use the convert command that is part of ImageMagik: convert -rotate 90 -trim -antialias -density 100x100 in.ps out.png Experiment with the -density option to see various resulting image sizes. The Windows screen should have 92 x 92 resolution; using these figures the image shown on screen (Windows) should have the same width that you specified in the -J (projection) option. It's only with proper use of the -density option that you get crisp, clear details in the PNG image. If you replace png with e.g. jpg in the output file suffix, the output should be in JPG format. I've only used PNG, though.
DATA REDUCTIONIf you receive georeferenced data from external sources you must be prepared to deal with a plethoria of Latitude and Longitude formats. Let's look into some common situations.
UKOOA P1/90 NAVIGATION DATADownload the UKOOA P1/90 format specification. It's a fixed-position format without any <SPACE> or <TAB> separators between fields, so it can be hard to read. However, by inserting appropriate comment field in the header, it can be made much more legible, as this example shows: H0100 SURVEY AREA ISFJORDEN, SVALBARD H0101 SURVEY DETAILS SVALEX-2005 H0102 VESSEL DETAILS R.V. HAAKON MOSBY H0104 STREAMER DETAILS 240 CH GECO NESSIE-3 H0200 SURVEY DATE AUGUST - SEPTEMBER 2005 H0201 FILE CREATED 16-Jan-2006 H0202 FILE VERSION UKOOA P1/1990 H0300 CLIENT SVALEX-2005 H0400 GEOPHYSICAL CONTRACTOR UNIVERSITY OF BERGEN, NORWAY H0500 POSITIONING CONTRACTOR N/A H0600 POSITIONING PROCESSING O.M. UNIVERSITY OF BERGEN, DEPT OF EARTH SCIENCE H0700 POSITIONING SYSTEM H0700 SURVEY COMPUTER SOFTWARE NAVIPAC, EIVA, DENMARK H0700 H0800 SHOTPOINT POSITION CENTRE OF SOURCE H1000 CLOCK TIME UTC H0900 OFFSET SHIP SYSTEM TO SP 70.0 M BEHIND H1200 SPHEROID AS SURVEYED A,1/F WGS-84 Spheroid 6378137.000 298.2572236 H1300 SPHEROID AS PLOTTED A,1/F WGS-84 Spheroid 6378137.000 298.2572236 H1400 GEODETIC DATUM AS SURVEYED WGS-84 H1500 GEODETIC DATUM AS PLOTTED WGS-84 H1700 VERTICAL DATUM SL : ECHO SOUNDER H1800 PROJECTION 001 UTM NORTHERN HEMISPHERE H1900 ZONE 33X NORTHERN HEMISPHERE H2000 GRID UNIT 1 METRE H2001 HEIGHT UNIT 1 METRE H2002 ANGULAR UNITS 1 DEGREES H2200 CENTRAL MERIDIAN 15 DEG E H2600 H2600 00011111111112222222222333333333344444444445555555555666666666677777777778 H2600 78901234567890123456789012345678901234567890123456789012345678901234567890 H2600 -NAME-><->---<-SP-><---LAT--><--LONG---><--EAST-><-NORTH-><-DEP><D><TIME>- SLine34-05 18781022.23N 141348.31E 482384.58677774.7 215.8242180734 SLine34-05 19781023.47N 141353.32E 482416.98677812.8 214.7242180755 SLine34-05 20781024.73N 141358.24E 482448.78677851.4 212.3242180816 SLine34-05 21781026.00N 1414 3.08E 482480.08677890.4 209.6242180837 SLine34-05 22781027.28N 1414 7.88E 482510.98677929.7 207.6242180858 SLine34-05 23781028.53N 141412.83E 482543.08677968.1 206.2242180919 The lines starting with H2600 are just comments. You will notice that: 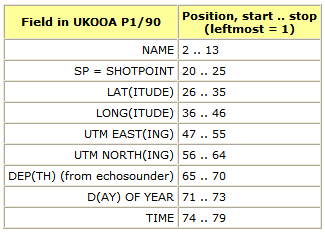 Degrees (D), Minutes (M) and Seconds (S) of Latitude/longitude as given as (D)DDMMSS.SS. Notice the longitudes marked like this: 1414 3.08E. Here we have 3.08 seconds, and the leftmost field is simply vacant; the same applies to the Minute and Degree fields, should they only need one digit. GPS NMEAWe are presented with a data file, gps.dat, containing three NMEA telegrams, $GPRMC, $GPGGA, $GPVTG, for each position: $GPRMC,103409,A,6028.3420,N,00519.9763,E,000.0,000.0,040805,002.4,W*6B $GPGGA,103409,6028.3420,N,00519.9763,E,1,10,0.8,106.9,M,43.9,M,,*4B $GPVTG,000.0,T,002.4,M,000.0,N,0000.0,K*78 $GPRMC,103410,A,6028.3420,N,00519.9763,E,000.0,000.0,040805,002.4,W*63 $GPGGA,103410,6028.3420,N,00519.9763,E,1,10,0.8,106.9,M,43.9,M,,*43 $GPVTG,000.0,T,002.4,M,000.0,N,0000.0,K*78 How are we to extract latitude and longitude, and convert the NMEA position format (D)DDMM.MMMM to decimal degrees? There are, of course, different approaches. Here we use awk to select lat/long from GPRMC telegrams: cat gps.dat | awk -F ',' '/GPRMC/ {print $4, $5, $6, $7}' > gps.dat.latlong
The output will be: 6028.3420 N 00519.9763 E 6028.3420 N 00519.9763 E UTM > Long/LatIf data are in Easting/Northing UTM coordinates, you can convert them to Long/Lat by the GMT mapproject command. If you have a file with Easting/Northing pairs (space separated) called UTM.dat, with data from Isfjorden, Svalbard (UTM zone 33X), write: cat UTM.dat | mapproject -Ju33/1:50000 -R13.99/78.06/15.7/78.32r -I -F -C > UTM.dat.2LongLat Alternatively, download LatLongUTMconversion, Python library code that converts between Lat/Long and UTM, from http://www.pygps.org/#LatLongUTMconversion Not active any longer (Jan 10, 2012).
SEISMIC SURVEY SHOT POINT MAPS 
GMT / CARTHOGRAPHY LINKS (9 January 2014: This section outdated.)
Carthography
GIS
GIS / Mapping software (See also Matching the Map Projection to the Need)
GMT
DATA SETS (9 January 2014: This section is probably outdated.)Data set section maintained by: Asbjørn Breivik, Department of Earth Science, University of Bergen, Norway
Now at: Department of Geoscience, University of Oslo, Norway
This is a compilation of geographical data for use with GMT programs. A number of high-quality data sets are available, and some are collected here on a separate disk partition, mounted on machines pandora and charisma (Unix network). The main disk data structure is listed below, and additional information (GMT-scripts and data formatting examples) can be found here: /gmtdata/
/gmtdata/bathym/
/gmtdata/bathym/etopo-5/
/gmtdata/bathym/etopo-2/
/gmtdata/bathym/gebco/
/gmtdata/bathym/ibcao/
/gmtdata/bathym/sandwell/
/gmtdata/topo/gtopo30/
/gmtdata/topo/globe/*/
/gmtdata/grav/
/gmtdata/grav/arctic/
/gmtdata/grav/ers-1/
/gmtdata/grav/sandwell/
/gmtdata/mag/gsc/
/gmtdata/geoid/
/gmtdata/seafloor_age/
Gravity: Satellite Free Air gravity grid (from ERS and Seasat missions).Version 10.1 of the satellite Free Air gravity grid derived from ERS and Seasat missions. It appears a little less noisy than the 9.1 release due to a slightly higher low-cut filtering: File: /gmtdata/grav/sandwell/grav_10.1.grd Data coverage (degrees): -180 to 180, 72S to 72N
Version 9.1 files are now placed under directory /gmtdata/grav/sandwell/9.1/ References:
LAST UPDATE: May 2004
Gravity: KMS 1999 release of the ERS 1 satellite derived Free Air gravity field.File: /gmtdata/grav/ers-1/ers_1_world.grd
Reference:
LAST UPDATE: April 2002
Gravity: 3.75 arc-minute resolution satellite Free Air gravity field from ERS 1.File: /gmtdata/grav/ers-1/ers_1_world.grd
LAST UPDATE: 1995
Arctic Gravity ProjectFrom the announcement: Public domain gravity grids derived from airborne, surface and submarine data in the Arctic from a multitude of sources. Data have been prepared by a working group under the International Gravity and Geoid Commission, International Association of Geodesy, chaired by Rene Forsberg (National Survey and Cadastre of Denmark / KMS) and Steve Kenyon (National Imagery and Mapping Agency / NIMA) Files: /gmtdata/grav/arctic/arctic_fa*.grd
File: /gmtdata/grav/arctic/arctic_fa.grd
File: /gmtdata/grav/arctic/arctic_fa5x10.grd
File: /gmtdata/grav/arctic/arctic_faba5x10.grd
LAST UPDATE: April 2003
Bathymetry: 2 arc-minute resolution bathymetry2 arc-minute resolution bathymetry based on predictive batymetry from satellite gravity measurements for the shorter wavelengths, calibrated against ship track measurements for longer wavelengths. This grid is great for imaging depth variations and structure, but is not allways accurate on depth, as the nature of the predictive batymetry will also incorporate a signal from depth-to-basement variations and density inhomogeneities. (Smith and Sandwell data-set). Land data is from the GTOPO30 data, blockmedianed to 2 minutes on a Mercator grid and then merged with the ocean and shoreline constraints. File: /gmtdata/bathym/sandwell/topo_8.2.grd
References:
LAST UPDATE: April 2002
Bathymetry: IBCAO ship track bathymetry grid for the arctic regionsThe IBCAO ship track bathymetry grid for the arctic regions down to 64N is released in version 1.0. The data will provide both accuracy and resolution for the northern seas. From their web-page: Project Overview: The goal of this initiative is to develop a digital data base that contains all available bathymetric data north of 64 degrees North, for use by mapmakers, researchers, and others whose work requires a detailed and acurate knowledge of the depth and the shape of the Arctic seabed. From the technical reference guide: A coastline definition was achieved by using the World Vector Shoreline (WVS)database in all areas except Greenland and northern Ellesmere Island,where an updated coastline was available from the Danish National Survey and Cadastre (KMS),and Kvitøya were GTOPO 30 (described below)was used to delineate the coast. Gridded sources Land relief was derived largely from the US Geological Survey's topographic model GTOPO 30,with the exception of Greenland where the topographic model developed by KMS was used [Ekholm ,1996 ]. (Note: due to this, there will be a misfit with the GMT coastline data base for Greenland). File: /gmtdata/bathym/ibcao/IBCAO_1.0.grd
Reference:
LAST UPDATE: April 2002
Bathymetry: GEBCO 1 arc minute ship track world bathymetry gridFrom the GEBCO GDA Centenary Edition CD-ROM cover: Users should be aware that, even to the present day, most areas of the world's oceans have not been fully surveyed and that, in general, data coverage is sparse. For the most part, bathymetric mapping is an interpretation based on random track lines of sounding data from many different sources. The quality and coverage of data from these sources is highly variable. File: /gmtdata/bathym/gebco/grid/gridone.grd
/gmtdata/bathym/gebco/gridfive/gridfive.grd
/gmtdata/bathym/gebco/contours/sector*.asc
/gmtdata/bathym/gebco/contours/coast.xy
/gmtdata/bathym/gebco/contours/natl.xy
/gmtdata/bathym/gebco/geodas/geodas.asc
/gmtdata/bathym/gebco/ibcm/ibcm*.asc
/gmtdata/bathym/gebco/scar/*.asc
/gmtdata/bathym/gebco/tracks/sector*.asc
LAST UPDATE: June 2003
Bathymetry: 5 arc-minute ETOPO 5 grid5 arc-minute ETOPO 5 grid, which is good for regional maps, but lacks resolution compared to the IBCAO data-set. (This grid file was not installed from a primary source, but from the Dept. of Geology, University of Oslo). File: /gmtdata/bathym/etopo-5/topo_world.grd
LAST UPDATE: mid-1990's
Land topography: GTOPO30The U.S. Geological Survey developed a DEM called GTOPO30, a 30x30 arc sec. land topography data set. Here a subset is installed: File: /gmtdata/topo/gtopo30/gtopo30N.grd/grd
Reference: LAST UPDATE: April 2002
GLOBEFrom Refrerence: The Global Land One-kilometer Base Elevation (GLOBE) digital elevation model is the most thoroughly designed, reviewed, and documented global digital elevation dataset to date. GLOBE was developed by an international group of specialists, cooperating with the Committee on Earth Observation Satellites (CEOS) Working Group on Information Systems and Services (WGISS), International Geosphere-Biosphere Programme's Data and Information System (IGBP-DIS), and IGBP Working Group IV/6. GLOBE comprises a global 30 arc-second latitude-longitude array, with land areas populated with integer elevation data. File: /gmtdata/topo/globe/*/*.grd (sub-areas, see directory for names)
Reference: LAST UPDATE: April 2002 OTHER available elevation and geographical data sets currently not installed:
MAGNETICA CD-ROM with magnetic data for northern parts of the northern hemisphere has recently been purchased from the Geological Survey of Canada. It is compiled from ship track and aeromag data, and the map is low pass filtered at 400 km. I have converted the original 5x5 km cartesian grid to a 2.5mx2.5m geographical coordinate GMT format grid. File: /gmtdata/mag/gsc/gsc_mag.grd
Reference:
LAST UPDATE: October 2001
GEOIDA 7.5 arc-minute EGM-96 (order 360) grid of the Earth's geoid height at sea is derived from satellite altimetry measurements. (This grid file was not installed from a primary source, but from the Dept. of Geology, University of Oslo). File: /gmtdata/geoid/egm96_360_geoid.grd
Reference: LAST UPDATE: 1997
SEAFLOOR AGEA 7.5 arc-minute grid from poster made by Dietmar Mueller and others show the age of the Earth's seafloor. (This grid file was not obtained from a primary source, but from the Dept. of Geology, University of Oslo). Data coverage (degrees): 0 to 360, 72S to 72N File: /gmtdata/seafloor_age/muller_et_al_globalage.grd
Reference:
LAST UPDATE: 1998 |
||||||||||


