|
Surveys and data Instruments
Support to other department sections Support Dr. Scient. thesis Contribution to "Scientific infrastructure"
Obsolete, kept for reference
Last update: April 30, 2025, at 08:49 AM |
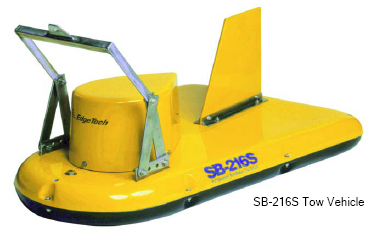
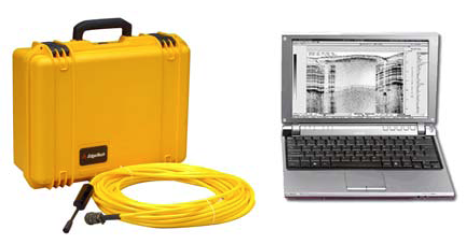
INTRODUCTION RV "Hans Brattström", Institute of Marine Research, Bergen, Norway. Link to image source. Survey conducted in the period xx-yy June, 2017, using RV "Hans Brattström". Project leader GEO/UiB: Prof. Haflidason Data collecting instrument: EDGETECH 3100-P SUB-BOTTOM PROFILER.
NAV DATAFiles
Processing of Nav track data filesSample input file: "navtrack.dat001.nav"0 3684.4210 405.1333 165 0.0 0 7 2 48 -70.9 10 0.00 0 0 3684.4209 405.1333 248 0.0 0 7 2 50 -70.9 11 0.00 0 0 3684.4209 405.1332 218 0.0 0 7 2 52 -70.9 12 0.00 0 0 3684.4208 405.1332 281 0.0 0 7 2 54 -70.9 13 0.00 0 0 3684.4209 405.1332 271 0.0 0 7 2 56 -70.9 14 0.00 0 0 3684.4209 405.1332 258 0.0 0 7 2 58 -70.9 15 0.00 0 0 3684.4209 405.1332 271 0.0 0 7 3 0 -70.9 16 0.00 0 0 3684.4211 405.1334 61 0.0 0 7 3 2 -70.9 17 0.00 0 0 3684.4211 405.1336 24 0.0 0 7 3 4 -70.9 18 0.00 0 0 3684.4212 405.1336 46 0.0 0 7 3 6 -70.9 19 0.00 0 Python script
f = open("navtrack.dat001.nav")
print "line_number,latitude,longitude,time"
line_number = 1
for line in f:
	s = line.split()
	lat = float(s[1]) / 60.0
	lon = float(s[2]) / 60.0
	time_stamp = "%02d:%02d:%02d"   %   ( int(s[6]), int(s[7]), int(s[8]) )
	point = "%05d,%1.7f,%1.7f,%s"   %  (line_number, lat, lon, time_stamp)
	print point
	line_number += 1
f.close()
Sample output file "navtrack.dat001.nav.txt"line_number,latitude,longitude,time 00001,61.4070167,6.7522217,07:02:48 00002,61.4070150,6.7522217,07:02:50 00003,61.4070150,6.7522200,07:02:52 00004,61.4070133,6.7522200,07:02:54 00005,61.4070150,6.7522200,07:02:56 00006,61.4070150,6.7522200,07:02:58 00007,61.4070150,6.7522200,07:03:00 00008,61.4070183,6.7522233,07:03:02 00009,61.4070183,6.7522267,07:03:04 00010,61.4070200,6.7522267,07:03:06 On-line map plots, as QC indicationIt's possible to upload nav data files and get map plots in return, from this web page: http://www.gpsvisualizer.com/ |
||||||||||||||||||||||||||||||||||||||||||||||||||||||||||