
|
Surveys and data Instruments
Support to other department sections Support Dr. Scient. thesis Contribution to "Scientific infrastructure"
Obsolete, kept for reference
Last update: April 30, 2025, at 08:49 AM |
AEGIR RIDGE OBS AND DREDGING SURVEY 2010 Click to see plot of ship position, track line, weather ++. 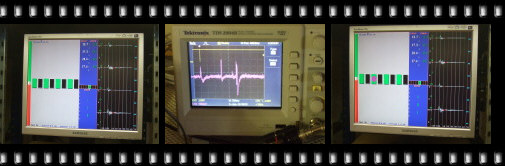 Click to open photo album.  Aegir Ridge OBS and Dredging Survey, May/June 2010 (map by A.B.).
SURVEY, PROJECT DESCRIPTION
GEOPHYSICAL EQUIPMENT
HSE
LOG SHEET
DATA AND SOFTWARE
Software
OBS positionsTransit data
Gravity data (raw)
Gaps in gravity dataThere are two gaps in gravity data. Both are outside both profile and main transit periods. They are caused to forgetting to activate Spring Tension after Daily Check. (It has only happened on this survey.) Spring tension will remain constant, and raw beam position will slowly move very far from center. NOTE: After Spring Tension is activated again it will still take some time before data are valid - check/plot data to investigate. Gap 1
Gap 2
GRAVITYMETER BASE READINGSSummary
 Delta gabs =
 Delta hw =
 Delta av =

 Drift rate = ( hw*0.3086 - S38delta av ) / delta tv
27 May 2010Gravitymeter still reading: Day, time DG ST CC RAW TC 147:19:24:00 9203.4 9204.0 .0 -21 -0.3 Measurements Realfagbygget:
Measurements Nygårdsvik:
Distance to sea surface: 2.10 m Gravitymeter still reading: Day, time DG ST CC RAW TC 147:20:50:00 9203.5 9203.6 .0 -41.0 -
27 May: Last-minute change in Spring Tension
Excerpt from relevant log file 2010_147.DAT (raw data on gravitymeter hard disk). NOTE: Spring tension change is not instantaneous, so it will take some time (> 1 min) before the new value is reached. But it seems that spring tension software switch was not touched during this operation, as spring tension value continues to change after target value is reached. Ship left pier very shortly afterwards. MY_LINE # 201014721 7 0 9203.53 9203.56 .00 -43.3 0. 0. 0. 0. 0. 0. 0. 0. 0.00FFFFFF 11. MY_LINE # 201014721 710 9203.53 9203.56 .00 -43.3 0. 0. 0. 0. 0. 0. 0. 0. 0.00FFFFFF 11. MY_LINE # 201014721 720 9203.53 9203.56 .00 -43.4 0. 0. 0. 0. 0. 0. 0. 1. 0.00FFFFFF 11. MY_LINE # 201014721 730 9203.53 9203.56 .00 -43.4 0. 0. 0. 0. 0. 0. 0. 1. 0.00FFFFFF 11. MY_LINE # 201014721 740 9203.53 9203.56 .00 -43.5 0. 0. 0. 0. 0. 0. 0. 1. 0.00FFFFFF 11. MY_LINE # 201014721 750 9203.54 9203.03 .00 -43.5 0. 0. 0. 0. 0. 0. 0. 1. 0.00FFFFFF 11. MY_LINE # 201014721 8 0 9203.53 9200.09 .00 -43.6 0. 0. 0. 0. 0. 0. 0. 1. 0.00FFFFFF 11. MY_LINE # 201014721 810 9203.53 9194.92 .00 -43.6 0. 0. 0. 0. 0. 0. 0. 1. 0.00FFFFFF 11. MY_LINE # 201014721 820 9203.51 9188.70 .00 -43.6 0. 0. 0. 0. 0. 0. 0. 1. 0.00FFFFFF 11. MY_LINE # 201014721 830 9203.49 9182.44 .00 -43.6 0. 0. 0. 0. 0. 0. 0. 0. 0.00FFFFFF 11. MY_LINE # 201014721 840 9203.44 9176.78 .01 -43.4 0. 0. 0. 0. 0. 1. 0. 0. 2.00FFFFFF 11. MY_LINE # 201014721 850 9203.38 9172.01 .01 -43.2 0. 0. -1. 0. 0. 1. 0. -1. 3.00FFFFFF 11. MY_LINE # 201014721 9 0 9203.28 9168.20 .01 -43.4 0. 0. -1. 1. 0. 1. 0. -2. 2.00FFFFFF 11. MY_LINE # 201014721 910 9203.15 9165.24 .01 -43.8 0. 0. -1. 1. 0. 2. 0. -1. -1.00FFFFFF 11. MY_LINE # 201014721 920 9202.98 9163.01 .01 -44.1 0. 0. -2. 1. 0. 2. 0. 0. -3.00FFFFFF 11. MY_LINE # 201014721 930 9202.76 9161.34 .01 -44.3 0. 0. -1. 1. 0. 2. 0. 0. -5.00FFFFFF 11. MY_LINE # 201014721 940 9202.49 9160.09 .00 -44.3 0. 0. -1. 1. 0. 2. 0. -1. -5.00FFFFFF 11. MY_LINE # 201014721 950 9202.14 9159.16 .00 -44.3 0. 0. -1. 1. 0. 1. 0. -1. -5.00FFFFFF 11. MY_LINE # 20101472110 0 9201.72 9158.48 .00 -44.0 0. 0. -1. 0. 0. 1. 0. -1. -4.00FFFFFF 11. MY_LINE # 2010147211010 9201.22 9157.98 .00 -43.8 0. 0. -1. 0. 0. 1. 0. 0. -2.00FFFFFF 11. MY_LINE # 2010147211020 9200.62 9157.61 .00 -43.5 0. 0. -1. 0. 0. 1. 0. 1. -1.00FFFFFF 11. MY_LINE # 2010147211030 9199.91 9157.35 .00 -43.3 0. 0. 0. 0. 0. 1. 0. 2. 0.00FFFFFF 11. MY_LINE # 2010147211040 9199.09 9157.17 .00 -43.1 0. 0. 0. 0. 0. 1. 0. 2. 1.00FFFFFF 11. MY_LINE # 2010147211050 9198.15 9157.04 .00 -42.8 0. 0. 0. 0. 0. 0. 0. 3. 2.00FFFFFF 11. MY_LINE # 20101472111 0 9197.09 9156.95 .00 -42.7 0. 0. 0. 0. 0. 0. 0. 2. 2.00FFFFFF 11. MY_LINE # 2010147211110 9195.89 9156.89 .00 -42.4 0. 0. 0. 0. 0. 0. 0. 2. 2.00FFFFFF 11. MY_LINE # 2010147211120 9194.57 9156.85 .00 -42.1 0. 0. 0. 0. 0. 0. 0. 0. 3.00FFFFFF 11. MY_LINE # 2010147211130 9193.13 9156.82 .00 -41.7 0. 0. 0. 0. 0. 0. 0. -2. 3.00FFFFFF 11. MY_LINE # 2010147211140 9191.56 9156.81 .00 -41.3 0. 0. 0. 0. 0. 0. 0. -4. 4.00FFFFFF 11. MY_LINE # 2010147211150 9189.88 9156.80 .00 -40.9 0. 0. 0. 0. 0. 0. 0. -3. 5.00FFFFFF 11. MY_LINE # 20101472112 0 9188.11 9156.79 .00 -40.4 0. 0. 0. 0. 0. 0. 0. -1. 6.00FFFFFF 11. MY_LINE # 2010147211210 9186.25 9156.79 .00 -39.9 0. 0. 0. 0. 0. 0. 0. 1. 7.00FFFFFF 11. MY_LINE # 2010147211220 9184.33 9156.79 .01 -39.4 0. 0. 0. 0. 0. 0. 0. 3. 8.00FFFFFF 11. MY_LINE # 2010147211230 9182.36 9156.79 .01 -38.5 0. 0. 0. 0. 0. 0. 0. 5. 13.00FFFFFF 11. MY_LINE # 2010147211240 9180.38 9156.79 .01 -37.3 0. 0. 0. 0. 0. 0. 1. 5. 20.00FFFFFF 11. MY_LINE # 2010147211250 9178.40 9156.79 .01 -36.3 0. 0. 0. 0. 0. 0. 1. 4. 23.00FFFFFF 11. MY_LINE # 20101472113 0 9176.45 9156.80 .01 -35.9 0. 0. 0. 0. 0. 0. 1. 2. 20.00FFFFFF 11.
13 June 2010Gravitymeter still reading: Day, time DG ST CC RAW TC 164:05:21:30 9155.7 9155.5 .0 20. .1 'Measurements Nygårdsvik:
Distance to sea surface: 2.85 m Measurements Realfagbygget
Measurements Nygårdsvik:
Distance to sea surface: 2.45 m Gravitymeter still reading: Day, time DG ST CC RAW TC 164:07:12:50 9155.5 9155.5 .0 -31 .0 K-check, 13 June 2010ST OFF Slew ST +30.0, wait > 5 min. -> TC = -28.5 Slew ST -60.0, wait > 5 min. -> TC = 28.7 Slew ST +30.0, wait > 5 min. -> TC = 0.0 ST ON MARINE OPERATING SYSTEM: 2.04 FOR METER S-38 Calibration table land gravity meter: Calibration table land gravity meter used during gravity ties. Click to enlarge. Gravity reference "REALFAGBYGGET, BERGEN"Data format, hard disk logging gravity PC
MINI-STREAMER DATACredits B.O. Ruud (GEO) for assistance in mini-streamer data handling: Processing steps in Seismic Unix: segyread tape=1535.sgy endian=0 | sugain tpow=1 | \ sufilter f=15,30,60,90 | suattributes | suop op=ssqrt | \ sustack key=fldr | sumix mix=1,2.2,2,2,1 | suximage perc=99 d2=0.2 & Suggestion by A.B.. Use Click to enlage:  Line 1 Mini-streamer data - click to enlarge.  Line 2 Mini-streamer data - click to enlarge.
TRACKLINE, WEATHER
UKOOA P1-90 NAV DATA FILESUTM Zone, reference point on vesselAll UTM data are relative to UTM Zone 30. All coordinates are also relative to the position of the gravitymeter on board the ship.  Gravitymeter is placed at frame 40. Frame distance is 0.6 m. Thus, gravitymeter is 40 x 0.6 m = 24.0 m from the stern. Airgun offset distanceAirguns are positioned 60 meter behind the stern. We have to add offset between gravitymeter and stern, to obtain the total offset between source and positions given in navdata files. Thus, total offset between source and positions given in nav data files is: 60 m + 24.0 m = 84.0 m. UKOOA P1/90 navdata formatOutput from nav data processing should be in UKOOA P1/90 format, slightly modified to accommodate three decimals in time value. The UKOOA P1/90 format specification can be downloaded from SEG. It's a fixed-position format without any <SPACE> or <TAB> delimiters between fields, so it can be hard to read. However, by inserting appropriate comment field in the header, it can be made much more legible, as this example shows. The first part is the header; the individual shot points are at the end (six lines) : H0100 SURVEY AREA ISFJORDEN, SVALBARD H0101 SURVEY DETAILS SVALEX-2005 H0102 VESSEL DETAILS R.V. HAAKON MOSBY H0104 STREAMER DETAILS 240 CH GECO NESSIE-3 H0200 SURVEY DATE AUGUST - SEPTEMBER 2005 H0201 FILE CREATED 16-Jan-2006 H0202 FILE VERSION UKOOA P1/1990 H0300 CLIENT SVALEX-2005 H0400 GEOPHYSICAL CONTRACTOR UNIVERSITY OF BERGEN, NORWAY H0500 POSITIONING CONTRACTOR N/A H0600 POSITIONING PROCESSING O.M. UNIVERSITY OF BERGEN, DEPT OF EARTH SCIENCE H0700 POSITIONING SYSTEM H0700 SURVEY COMPUTER SOFTWARE NAVIPAC, EIVA, DENMARK H0700 H0800 SHOTPOINT POSITION CENTRE OF SOURCE H1000 CLOCK TIME UTC H0900 OFFSET SHIP SYSTEM TO SP 70.0 M BEHIND H1200 SPHEROID AS SURVEYED A,1/F WGS-84 Spheroid 6378137.000 298.2572236 H1300 SPHEROID AS PLOTTED A,1/F WGS-84 Spheroid 6378137.000 298.2572236 H1400 GEODETIC DATUM AS SURVEYED WGS-84 H1500 GEODETIC DATUM AS PLOTTED WGS-84 H1700 VERTICAL DATUM SL : ECHO SOUNDER H1800 PROJECTION 001 UTM NORTHERN HEMISPHERE H1900 ZONE 33X NORTHERN HEMISPHERE H2000 GRID UNIT 1 METRE H2001 HEIGHT UNIT 1 METRE H2002 ANGULAR UNITS 1 DEGREES H2200 CENTRAL MERIDIAN 15 DEG E H2600 H2600 00011111111112222222222333333333344444444445555555555666666666677777777778 H2600 78901234567890123456789012345678901234567890123456789012345678901234567890 H2600 -NAME-><->---<-SP-><---LAT--><--LONG---><--EAST-><-NORTH-><-DEP><D><TIME>- SLine34-05 18781022.23N 141348.31E 482384.58677774.7 215.8242180734 SLine34-05 19781023.47N 141353.32E 482416.98677812.8 214.7242180755 SLine34-05 20781024.73N 141358.24E 482448.78677851.4 212.3242180816 SLine34-05 21781026.00N 1414 3.08E 482480.08677890.4 209.6242180837 SLine34-05 22781027.28N 1414 7.88E 482510.98677929.7 207.6242180858 SLine34-05 23781028.53N 141412.83E 482543.08677968.1 206.2242180919 UKOOA P1-90 navdata format structure. The shot point (SP) parameter, for instance, is located from column 20 to 25, as shown below. The two column numbering lines, together with the parameter name line, is an aid in determining the column position of the different parameters. These three "assist" lines are not common - they are only inserted by the software we use to generate UKOOA P1/90 files. +--------> Column 20 | | +---> Colomn 25 | | 222222 012345 <-SP-> 18 19 20 21 22 23 "OBS" modification of UKOOA P1/90 navdata formatOBS refraction surveys means that source (airguns on ship) and receivers (OBS placed on the bottom, or on land, as an extension of the profile) must maintain a common, accurate - to the nearest millisecond - time base. This is accomplished by special oven-controlled oscillators in the OBS instruments, and GPS locked clocks in land based instruments. On board the ship, the exact time of the shot point is recorded by two time-tagging systems operating in parallel (details provided in table of geophysical equipment above). The time field in the UKOOA P1/90 format only accommodates seconds without decimals. The format has been modified to permit storage of shot times with six decimal places, of which only the three most significant decimals are used. An example of modified file: H2600 FILE FORMAT MODIFIED TO INCLUDE SHOTPOINT TIME IN COLUMNS [7..19] H2600 H2600 00011111111112222222222333333333344444444445555555555666666666677777777778 H2600 78901234567890123456789012345678901234567890123456789012345678901234567890 H2600 <--SP TIME--><-SP-><---LAT--><--LONG---><--EAST-><-NORTH-><-DEP><D><TIME>- SSM-1 101921.956000 1632728.92N 74033.97E 732982.37045135.6 171.3297101921 SSM-1 102109.690000 2632728.28N 74019.50E 732783.87045101.1 172.4297102109 SSM-1 102251.455000 3632728.66N 740 5.07E 732583.57045098.3 176.4297102251 "EIVA" Survey Computer shot event log filesThe format of these shot point log files is as follows: Event Date Time Easting Northing St.d. Gyro Dal Dol Kp Object Data ----------------------------------------------------------------------------------------------------------- 000057 2010.06.02 02:51:41.914 0334654.77 07118140.71 00.90 038.1 00000.15 005.14 000.000 "H Mosby f " 3002.22 9449.08 52045.27 "" 01 000058 2010.06.02 02:52:59.662 0334792.73 07118285.63 00.80 037.7 00200.24 005.27 000.200 "H Mosby f " 3010.88 9448.82 52040.90 "" 01 000059 2010.06.02 02:54:19.285 0334928.16 07118432.47 00.80 037.6 00399.98 002.25 000.400 "H Mosby f " 3019.18 9449.93 52035.06 "" 01 000060 2010.06.02 02:55:36.205 0335067.61 07118575.91 00.70 037.9 00600.02 004.48 000.600 "H Mosby f " 3027.67 9451.44 52025.12 "" 01 Parameters are given in first line. Most are self-explanatory, except these:
The last item in each line ("" 01) can be ignored. Shot time stamp filesTime values in files generated by University of Bergen time stamp unit is given in UTC. $PUIBR,TTT,,02:51:42.7163,5595,7812*00 $PUIBR,TTT,,02:53:00.4707,3677,7812*00 $PUIBR,TTT,,02:54:20.0914,714,7812*00 $PUIBR,TTT,,02:55:37.0041,32,7812*00 Parameters are comma delimited. Record structure mimics NMEA GPS telegram format. Using first line as example, parameters are:
MAINTENANCE
TECHNICAL ISSUESThanks to D. Snartemo for notes regarding Deployment and retrieval of equipment, Magnetometer, Streamer, Torque values. Deployment and retrieval of equipmentOBS skyting 4 melkespann (hvert melkespann 1200 inch³ ):
Magnetometer
Streamer
Airgun volumes1 liter = 1/1000 m3 1 inch3 = (0.0254 m)3 = 0.000016387064 m3 1 inch3 = 0.016387064 liter Some common airgun volume sizes: 300 inch3 = 4.916 liter 240 inch3 = 3.933 liter 136 inch3 = 2.229 liter 90 inch3 = 1.475 liter 60 inch3 = 0.983 liter 1200 inch3 = 19.664 liter Airgun: Torque valuesMoment på mutter til stempel stang luftkanon: 1500 kanon -- 475 Nm -- 350 feet * lbs 1900 kanon -- 203 Nm -- 150 feet * lbs Bolter til feste av magnetventil: 22,6 Nm -- 200 in * lbs
Nm = Newton meter
lbs = pound
in = tommer
feet = fot
Airgun autofire6 June 2010: This problem was caused by intermittent failure in wire harness running from vessel to airguns. Initially, failure was only present when the guns were firing; it became gradually more regular. Spare harness also had similar fault. 3 June 2010: The Gun Controller often reports auto-fire in the second airgun, as shown on figure below.  reports auo-fire in the second gun.") Gun controller (GUNCO) reports auto-fire in the second gun. The GUNCO timescale only extends to 70-80 ms after Time Break (=zero time). It's not possible to hear any misfires in between the normal shots, which occur approx .every minute. Thus, it was tempting to write off this auto-fire as an electrical interference, and disable auto-fire warning for this particular gun. After connecting an oscilloscope to the airgun sensor signal line, and letting the GUNCO Scope FTB trigger the scope, the reason for the auto-fire report became clear. As shown in figures below, there is a signal approx 300 ms after time break, which is not supposed to be there. The erroneous signal could have one or two peaks. It can only be seen when GUNCO reports auto-fire on the affected gun.  Erroneous sensor signal.  Erroneous sensor signal. For comparison, a normal situation is shown in picture below.  Normal sensor signal. |
|||||||||||||||||||||||||||||||||||||||||||||||||||||||||||||||||||||||||||||||||||||||||||||||||||||||||||||||||||||||||||||||||||||||||||||||||||||||||||||||||||||||||||||||||||||||||